 MetaTrader 5
 Experts
 Indicators
 Scripts
 Libraries
 Storage
Watch how to download trading robots for free
Find us on Facebook!
Join our fan page
Join our fan page
You liked the script? Try it in the MetaTrader 5 terminal

Step VHF adaptive VMA - indicator for MetaTrader 5

- Views:
- 9680
- Rating:
- Published:
- Updated:
-
 You are missing trading opportunities:
- Free trading apps
- Over 8,000 signals for copying
- Economic news for exploring financial markets
Registration Log inYou agree to website policy and terms of use
If you do not have an account, please register -
 Need a robot or indicator based on this code? Order it on Freelance
Go to Freelance
Theory:
VMA (Variable Moving Average) is often mistakenly confused with the VIDYA (Volatility Index Dynamic Average) which is not strange since Tushar Chande took part in developing both. But the VMA was preceding the VIDYA and should not be mistaken for it. The formula for original VMA calculation is the following:
VMA = (α * VI * Price) + ((1 – ( α * VI )) * VMA[1])
Where:
α = 2 / (N + 1)
VI = Users choice of a measure of volatility or trend strength.
N = User selected constant smoothing period.
About this version:
This version is, as it is obvious from its name, adding two options and some changes.
- instead of using fixed user input for VI (the measure of volatility),and for which Tushar Chande was using Standard Deviation Ratio (SDR), it is using Adam Whites Vertical Horizontal Filter (VHF) and that way it makes it automatically adjust to current market volatility
- it is adding an option to filter out some insignificant changes in slope direction by using step calculation (setting the step size to 0 produces original VHF adaptive VMA - without steps filtering)
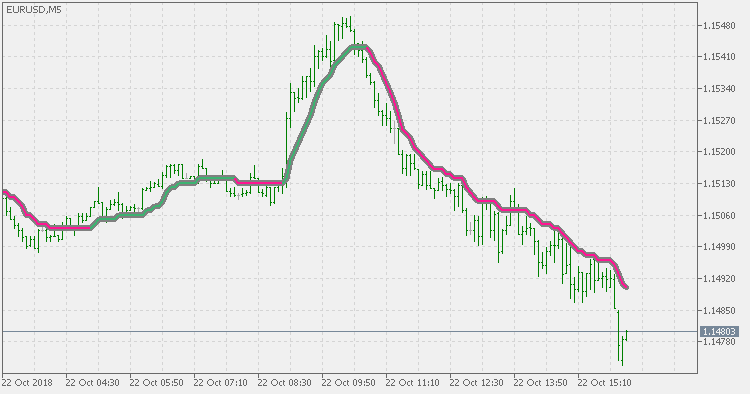
VMA, as is, is a "good candidate" for this type of filtering since it tends to produce prolonged periods of nearly horizontal values when the volatility of the market is low, so, when the step filtering is applied to it, the small slope changes that are happening as a results of the semi EMA calculation are filtered out, and signals are becoming more usable.
Usage:
You can use the color change as signals. Some experimenting with step size (since this version is using step size based on pips that is entered as users input).
Averages composite trend
Trend composed by a series of averages
Blau Ergodic TSI
Ergodic TSI (True Strength Index) as described by William Blau
Standard deviation ratio
Standard deviation ratio (SDR)
Standard deviation ratio adaptive EMA
Standard deviation ratio adaptive EMA