Watch how to download trading robots for free
Find us on Twitter!
Join our fan page
Join our fan page
You liked the script? Try it in the MetaTrader 5 terminal

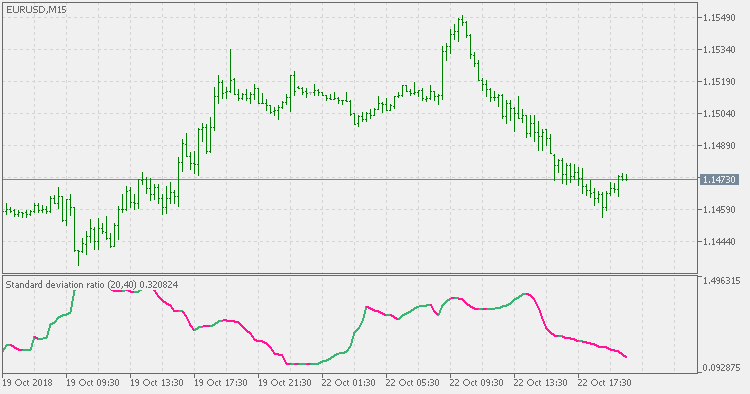
Standard deviation ratio - indicator for MetaTrader 5

- Views:
- 6606
- Rating:
- Published:
- Updated:
-
 You are missing trading opportunities:
- Free trading apps
- Over 8,000 signals for copying
- Economic news for exploring financial markets
Registration Log inYou agree to website policy and terms of use
If you do not have an account, please register -
 Need a robot or indicator based on this code? Order it on Freelance
Go to Freelance
Need a robot or indicator based on this code? Order it on Freelance
Go to Freelance
Theory:
The Standard Deviation Ratio (SDR) was first presented as a technical indicator in the March 1992 edition of Technical Analysis of Stocks & Commodities magazine ‘Adapting Moving Averages To Market Volatility‘. The author Tushar S. Chande, Ph.D. used it as the Volatility Index in the original version of his Volatility Index Dynamic Average (VIDYA) or Variable Moving Average (VMA).Calculating it is as simple as taking the ratio of a Standard Deviation (SD) over one period to that of a longer period where both have the same starting point. One quirk of the SDR is that because the short term SD can become greater than the longer term SD, the ratio has no upper limit but does tend to remain below 1 most of the time (see the example chart below). The higher the ratio, the more spread the recent data is from the mean in relation to the past which should indicate a stronger trend.
Usage:
The standard deviation ratio (SDR) on its own can be used in a similar mode as the regular standard deviation - as a measure of current market volatility (ie: it is not a directional indicator and it can not be used for trend direction determination - for that you need some other indicator combined with this one)
Step VHF adaptive VMA
Step VHF adaptive VMA
Averages composite trend
Trend composed by a series of averages
Standard deviation ratio adaptive EMA
Standard deviation ratio adaptive EMA
 Tunnel Method
Trading based on three iMAs (Moving Average, MA)