Join our fan page

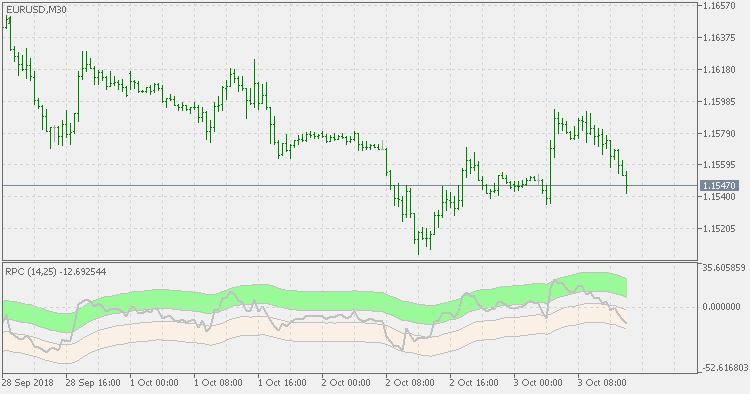
Relative price channel - indicator for MetaTrader 5

- Views:
- 9285
- Rating:
- Published:
- Updated:
-
 You are missing trading opportunities:
- Free trading apps
- Over 8,000 signals for copying
- Economic news for exploring financial markets
Registration Log inYou agree to website policy and terms of use
If you do not have an account, please register -
 Need a robot or indicator based on this code? Order it on Freelance
Go to Freelance
Need a robot or indicator based on this code? Order it on Freelance
Go to Freelance
Basics:
RSI indicator is frequently used in trading decisions coupled with levels checking. Levels are supposed to show if there is overbought or oversold condition. But frequently we are neglecting the fact that the market is adjusting itself to price changes, and that indicators like RSI may actually show overbought and oversold conditions even when the market already adjusted itself.
This version:
It is using the RSI and is constructing an high and low neutral zones using a simple EMA lag - in this case the lag of an average is our ally - without adding that lag, the breakout will never happen. When the RSI crosses the top most or lowest bound, only then consider that a "real" overbought or oversold condition is happening.
Usage:
You can use it for possible reversal conditions detecting.
Wilson Relative Price Channel - mod
Wilson Relative Price Channel - modification
Laguerre RSI - no gamma
Laguerre RSI - without using the gamma parameter
DSL QQE histo
Discontinued signal line QQE - histogram
ATR adaptive Laguerre filter
ATR adaptive Laguerre filter