Join our fan page
- Views:
- 6299
- Rating:
- Published:
-
Need a robot or indicator based on this code? Order it on Freelance Go to Freelance
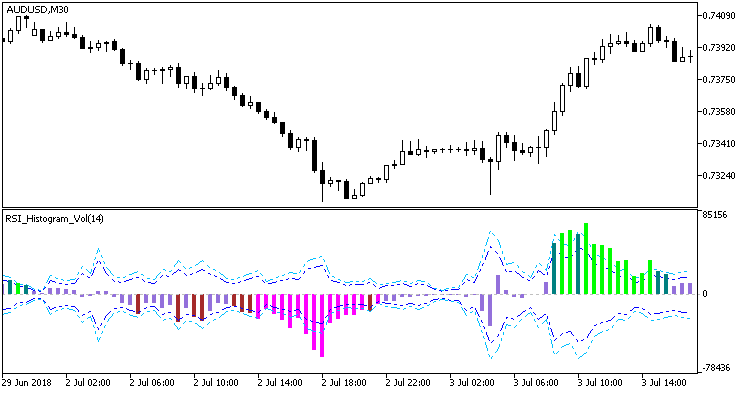
The Relative Strength Index oscillator displayed as a color histogram, using volumes.
Calculation formula:
RSI Histogram Vol = ( RSI - 50) * Volume
For quite understandable reasons, the recalculation of overbought and oversold levels in such a modified oscillator should be performed using the same formula. In the final version, these levels are no longer permanent. Two levels with the appropriate breakout indication were used.
input int                 HighLevel2=+20;           // Overbought level 2
input int                 HighLevel1=+15;           // Overbought level 1
input int                 LowLevel1=-15;            // Oversold level 1
input int                 LowLevel2=-20;            // Oversold level 2
In the indicator input parameters, these levels are shifted by the levels of 50 of the source RSI, and then multiplied by volumes at each indicator tick.

Fig. 1. The RSI_Histogram_Vol indicator
Translated from Russian by MetaQuotes Ltd.
Original code: https://www.mql5.com/ru/code/21831
 Exp_Trading_Channel_Index
A trading system based on the Trading_Channel_Index oscillator signals.
 Exp_Trend_Intensity_Index
A trading system based on the Trend_Intensity_Index oscillator signals.
 GD
GD
The Generalized DEMA moving average
 CCI_Histogram_Vol
The Commodity Channel Index oscillator displayed as a color histogram, using volumes.