Join our fan page

FGDI - indicator for MetaTrader 5
- Views:
- 6193
- Rating:
- Published:
-
 You are missing trading opportunities:
- Free trading apps
- Over 8,000 signals for copying
- Economic news for exploring financial markets
Registration Log inYou agree to website policy and terms of use
If you do not have an account, please register -
 Need a robot or indicator based on this code? Order it on Freelance
Go to Freelance
Need a robot or indicator based on this code? Order it on Freelance
Go to Freelance
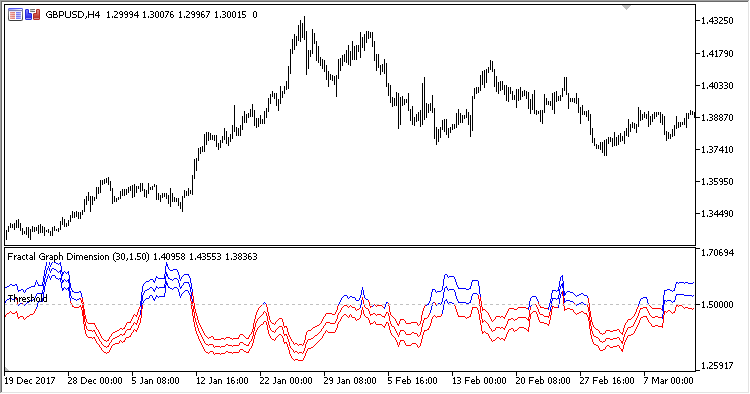
Fractal Graph Dimension Indicator shows the market state: trend or volatility.
It was described in "Technical Analysis of Stocks and Commodities" in March, 2007, in the article by Radha Panini, based on the article "A procedure to Estimate the Fractal Dimension of Waveforms" by Carlos Sevcik.
The indicator has three input parameters:
- Period - calculation period
- Applied price
- Threshold - the threshold level
Values below the threshold mean the trend state of the market and are displayed in red. Values above the threshold indicate the unstable volatile state and are displayed in blue.
Translated from Russian by MetaQuotes Ltd.
Original code: https://www.mql5.com/ru/code/21826
Forecast
The Forecast oscillator indicator
 Exp_Trend_Intensity_Index
A trading system based on the Trend_Intensity_Index oscillator signals.