Join our fan page

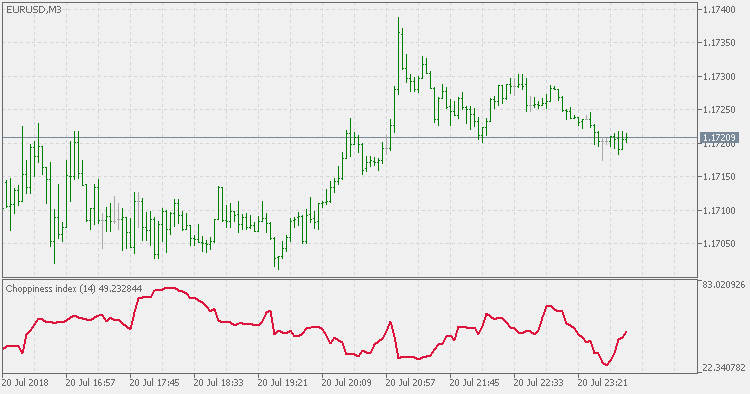
Choppiness Index - indicator for MetaTrader 5

- Views:
- 17854
- Rating:
- Published:
-
 You are missing trading opportunities:
- Free trading apps
- Over 8,000 signals for copying
- Economic news for exploring financial markets
Registration Log inYou agree to website policy and terms of use
If you do not have an account, please register -
 Need a robot or indicator based on this code? Order it on Freelance
Go to Freelance
Need a robot or indicator based on this code? Order it on Freelance
Go to Freelance
Choppiness Index: another way of calculating fractal dimension.
Choppiness
Choppiness is a modern indicator based on ideas of chaos theory and fractal geometry. Benoit Mandelbrot was the one person most responsible for the great interest in the subject of fractal geometry. He showed how fractals can occur in many different places in both mathematics and elsewhere in nature. They could be found underlying cloud formations, waves, leaves, fingerprints, and sunflowers, and his ideas provided some exciting glue between mathematics and nature. Using computer graphics and with the help of IBM, Mandelbrot was able to show how to express fractal geometry using computer graphics.
While most of us think there are only whole number dimensions, like 1D, 2D, and 3D, in fractal geometry there exist fractional dimensions in between the whole number dimensions. So there are a number of fractal dimensions between a 1D line and a 2D plane. Fractals are basically a measurement of the dimensionality of a system; they are able to express different images based on the fractional nature of dimension.
E. W. Dreiss, a trader based in Australia, came up with the creative idea of using fractal geometry as a way to measure price movement in a security. He cleverly assigned a "dimension" to a price movement chart. A chart that was trending and linear could be given the whole dimension of 1 while a chart that was totally choppy and not trending could be said to have a dimension of 2. Somewhere in between these two values represented fractional states and different degrees of choppiness.
Random Walk Index - JMA Smoothed
In order to avoid the too many signals that the regular Random Walk Index tends to produce, this version is using JMA for smoothing which significantly lessens the number of false signals.
Random Walk Index
The Random Walk Index attempts to determine when the market is in a strong uptrend or downtrend by measuring price ranges over N and how it differs from what would be expected by a random walk (randomly going up or down). The greater the range suggests a stronger trend. The RWI states that the shortest distance between two points is a straight line and the further prices stray from a straight line, implies the market is choppy and random in nature.
Choppiness Index - JMA Smoothed
Compared to the Choppiness Index indicator, this version is using JMA for smoothing (to make it easier to spot the slope direction change of the choppiness index) and to make the values less volatile.
Synthetic VIX - Smoothed
Smoothed version of Synthetic VIX.