Join our fan page

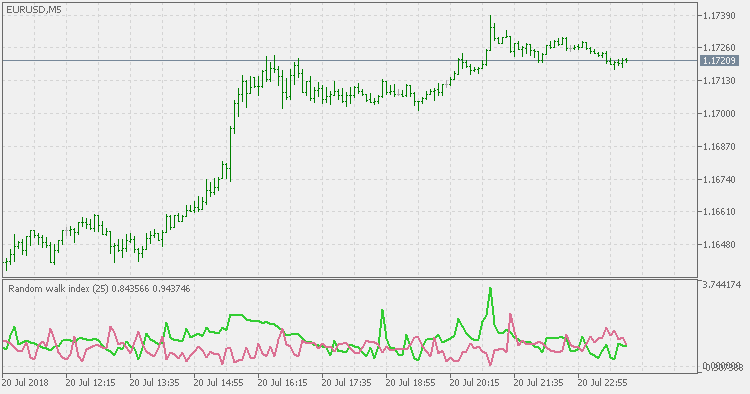
Random Walk Index - indicator for MetaTrader 5

- Views:
- 8493
- Rating:
- Published:
-
 You are missing trading opportunities:
- Free trading apps
- Over 8,000 signals for copying
- Economic news for exploring financial markets
Registration Log inYou agree to website policy and terms of use
If you do not have an account, please register -
 Need a robot or indicator based on this code? Order it on Freelance
Go to Freelance
Need a robot or indicator based on this code? Order it on Freelance
Go to Freelance
The Random Walk Index (RWI) is a technical indicator that attempts to determine if a stock's price movement is of random nature or a result of a statistically significant trend.
The Random Walk Index attempts to determine when the market is in a strong uptrend or downtrend by measuring price ranges over N and how it differs from what would be expected by a random walk (randomly going up or down). The greater the range suggests a stronger trend. The RWI states that the shortest distance between two points is a straight line and the further prices stray from a straight line, implies the market is choppy and random in nature.
Random Walk Index Formula
The Random Walk Index determines if a security is in an uptrend or downtrend. For each period the RWI is computed by calculating the maximum of the following values for high periods:
(HI - LO.n) / (ATR.1(n) * SQRT(n))
RSX QQE New
Compared to the original QQE indicator, this version instead of using trailing levels uses fixed levels to estimate overbought and oversold conditions. This version is also using RSX (a smoother RSI without a lag) in order to further purify the signals.
RSX QQE Histo
Compared to the original QQE indicator this version is adding fixed levels (to help further estimate the trend) and color changing histogram (based on those levels), and also using RSX (a smoother RSI without a lag) in order to further purify the signals.
Random Walk Index - JMA Smoothed
In order to avoid the too many signals that the regular Random Walk Index tends to produce, this version is using JMA for smoothing which significantly lessens the number of false signals.
Choppiness Index
Choppiness Index: another way of calculating fractal dimension.