Join our fan page

Wildhog - indicator for MetaTrader 5
- Views:
- 7075
- Rating:
- Published:
- Updated:
-
 You are missing trading opportunities:
- Free trading apps
- Over 8,000 signals for copying
- Economic news for exploring financial markets
Registration Log inYou agree to website policy and terms of use
If you do not have an account, please register -
 Need a robot or indicator based on this code? Order it on Freelance
Go to Freelance
Need a robot or indicator based on this code? Order it on Freelance
Go to Freelance
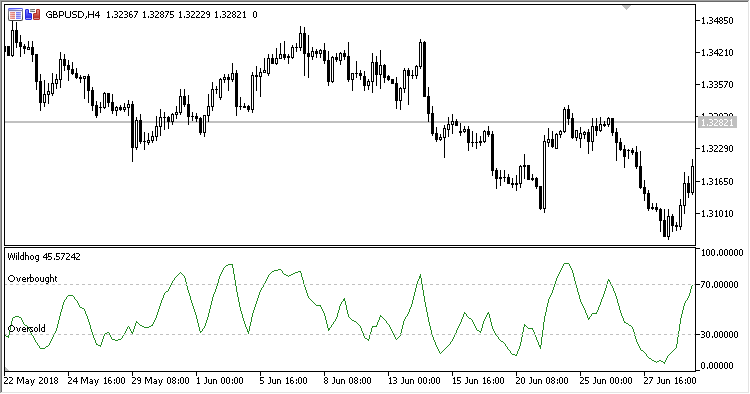
Wildhog oscillator displays asset's overbought/oversold states, as well as searches for divergences. It works on any timeframe.
The system is based on the last High, Low and Close eight bars.
The indicator has three input parameters:
- Period - calculation period
- Overbought - overbought level
- Oversold - oversold level
Calculation:
Wildhog = 100 * (Close-Min) / (3 * (Max-Min)) + PrevWildhog
where:
Max, Min are the highest and lowest prices within the Period interval
Translated from Russian by MetaQuotes Ltd.
Original code: https://www.mql5.com/ru/code/21393
DEMA_Range_Channel_HTF
DEMA_Range_Channel indicator with the timeframe selection option available in input parameters
DirectCandlesCounter_Candle
DirectCandlesCounter indicator in the form of candles.
 MostasHaR15 Pivot
The EA uses the following indicators: iADX (Average Directional Movement Index, ADX), two iMAs (Moving Average,MA) - one indicator at CLOSE prices and another one at OPEN prices, iOsMA (Moving Average of Oscillator, OsMA).
AMA Histogram
The histogram displays the difference of a Close price and iAMA (Adaptive Moving Average, AMA) indicator value.