Join our fan page

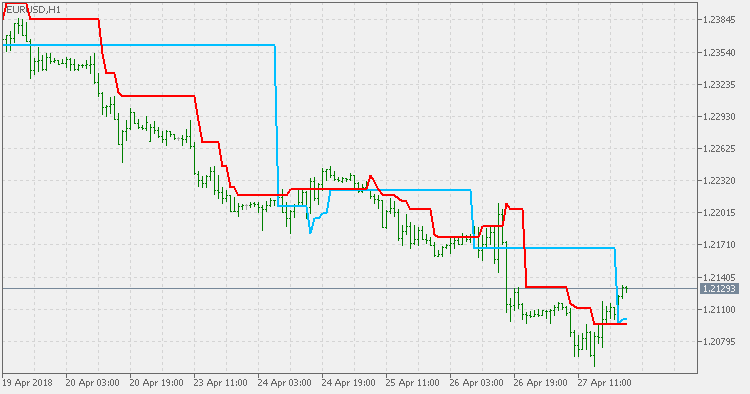
Count Back Lines - indicator for MetaTrader 5

- Views:
- 14726
- Rating:
- Published:
-
 You are missing trading opportunities:
- Free trading apps
- Over 8,000 signals for copying
- Economic news for exploring financial markets
Registration Log inYou agree to website policy and terms of use
If you do not have an account, please register -
 Need a robot or indicator based on this code? Order it on Freelance
Go to Freelance
Need a robot or indicator based on this code? Order it on Freelance
Go to Freelance
Indicator developed based on the original explanation of Daryl Guppy:
APPLYING THE COUNT BACK LINE ENTRY By Daryl Guppy
All users must know the correct starting point for the CBL (Count Back Line) calculation. The increasing incidence of double bottoms has led to some confusion about which low should be used in the calculation. These notes are designed to explain the construction process, and to show how the technique is integrated with other indicators.
The CBL is not designed as a stand alone technique. It is the final step in planning a trade that has been signaled by other indicators. My preferred combination includes the use of straight edge trend lines and the Guppy Multiple Moving Average (MMA). The objective is to identify when a downtrend has turned into an up trend. The focus is on breakout trading and the objective is to plan an entry as close as possible to the pivot point low. This is the low that sets the ultimate low point of the downtrend. We cannot know which bar is this until after the event. But if we know as soon as possible then we have an advantage because we capture the early part of the trend change.
The CBL is also used to manage entries into an established trend. Here it works as a stop loss function, and we will look at this in a later series of notes.
When we select a stock we use methods which manage risk at one level. When we actually buy the stock we take on a different type of risk which is broadly execution risk. This risk is complicated by our actual ability or inability to get in or out at the price we would like to.
It is a trend following tool which is designed to confirm the reversal of a short term trend. This is an important modifier. The count back line is not designed to identify and define a long term trend. We use the MMA for this.
The count back line is used to select the better entry points once we have received trend change signals from other sources. It is a tool that is used within the context of a previous selection. The count back line is used to create a short term hurdle which must be overcome before we can have any confidence of a likelihood of a trend change. It consists of four applications.
- The first is as a trend change verification tool.
- The second is as an entry tool with a defined range of safe price levels.
- The third is as a stop loss tool.
- The fourth is related to the stop loss function when it is used as an exit tool.
Our objective is not to predict the future, but to put the balance of probability in our favor. We start with the trend verification function. Assume for the moment that the MMA chart is already showing a strong potential for a trend reversal. We are looking for a trend change and we are prepared to follow the downtrend down until we get a definite signal that the change is taking place.
The count back line is used initially as a resistance line. It is calculated from the most recent low in the current trend. Any action between the count back line and the existing low point is ignored.
With each new low, we recalculate the position of the count back line. We wait until we get a close above the count back line before we act. Because we have already been alerted by the MMA relationship, we can take the count back line signal with confidence. It confirms what we already know. As the trend continues down we recalculate the count back line.
...
The rest can be found in his book: "Applying the Count Back Line Entry Trading on Volume and With ATR".
Volatility Bands Percent
This is the version that David Rooke proposes as a solution to Bollinger Bands issues in a percent representation.
Volatilty Bands
This is the version that David Rooke proposes as a solution to Bollinger Bands issues.
WPR with Bollinger bands
This version of Williams Percent Range has an addition of Bollinger bands to help identify possible overbought and oversold levels breaks.
Dynamic Pivots
Based on the Austin Passamonte's idea, this indicator calculates intra-day pivots.