Join our fan page

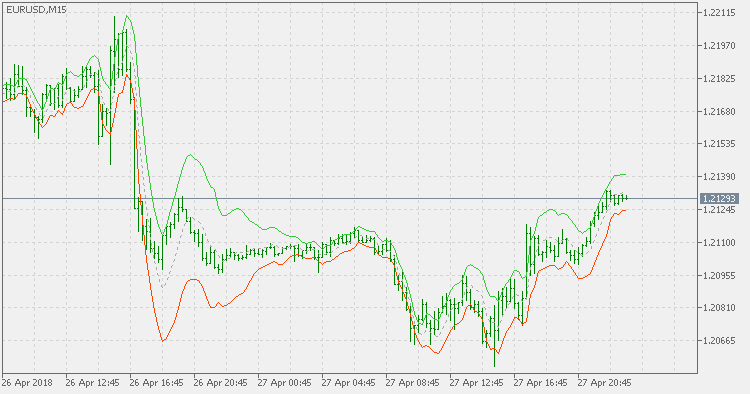
Volatilty Bands - indicator for MetaTrader 5

- Views:
- 6350
- Rating:
- Published:
-
 You are missing trading opportunities:
- Free trading apps
- Over 8,000 signals for copying
- Economic news for exploring financial markets
Registration Log inYou agree to website policy and terms of use
If you do not have an account, please register -
 Need a robot or indicator based on this code? Order it on Freelance
Go to Freelance
Need a robot or indicator based on this code? Order it on Freelance
Go to Freelance
From May 2010 issue of Futures magazine: Fixing the Bollinger Bands by David Rooke.
Popularized by John Bollinger, who gave them their name, Bollinger Bands are simply a plot of a multiple of the standard deviation of price from its Simple Moving Average (SMA), both above and below. By the use of standard deviation, we should reasonably expect that the distribution of price around the mean should conform to statistical normality, or get close to it.
Unfortunately, this is not the case for Bollinger Bands and has led to a search to fix the problem. Based on observations of Bollinger Bands, here are some of the issues:
- They are saddled with high lag, as virtually all SMA-based indicators are. Consequently, the user should be mindful of the delay in what the Bands present.
- They do not envelope price in a manner consistent with a Gaussian distribution. That is, 68.2% of prices should be found within one standard deviation of the sample mean, 95.4% of prices should be found within two standard deviations of the mean, etc. This will be described as the price/band ratio. While it can be debated whether daily price changes are normally distributed, the Bollinger price/band ratio can be said to offer little or no information from a probabilistic perspective.
- The price/band ratio is not scale invariant. That is, the price/band ratio from a given standard deviation does not remain constant as timescales increase.
This is the version that David Rooke proposes as a solution to fix the mentioned issues.
Linear Regression Study
Linear regression line with an addition of standard error channel projection.
WSO & WRO Channel
This version of WSO (Widner Support Oscillator) and WRO (Widner Resistance Oscillator) shows channel on chart instead of displaying oscillator values in a separate window.
Volatility Bands Percent
This is the version that David Rooke proposes as a solution to Bollinger Bands issues in a percent representation.
Count Back Lines
Indicator based on the Daryl Guppy's original strategy.