Join our fan page

BB MACD Extended - indicator for MetaTrader 5

- Views:
- 13608
- Rating:
- Published:
- Updated:
-
 You are missing trading opportunities:
- Free trading apps
- Over 8,000 signals for copying
- Economic news for exploring financial markets
Registration Log inYou agree to website policy and terms of use
If you do not have an account, please register -
 Need a robot or indicator based on this code? Order it on Freelance
Go to Freelance
Need a robot or indicator based on this code? Order it on Freelance
Go to Freelance
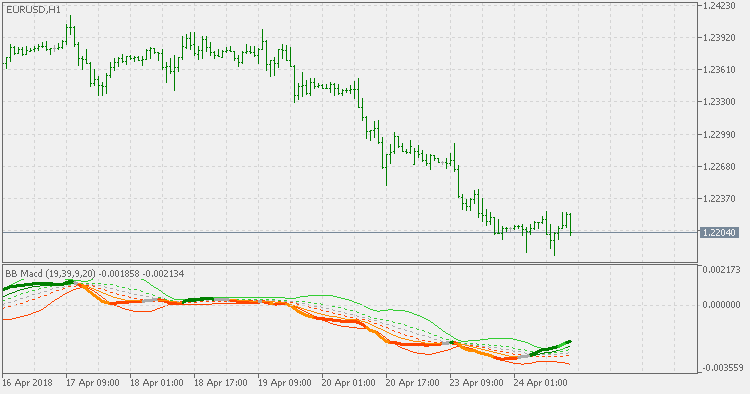
BB MACD is a MACD (Moving Average Convergence Divergence) indicator variation with an addition of Bollinger Bands, which helps in detecting trend change points and measuring current trend's strength.
The indicator is separated into three parts:
- The "line" part which is the colored MACD value.
- The "channel" part which is the Bollinger Bands drawn that way to make it easier to spot the changes of MACD within the channel.
- The "early levels" part which is the Bollinger Bands using smaller deviations multiplication for early assessment of MACD trend change.
Weekly Fibo Levels
Calculation is based on current week open and previous week range.
Heiken Ashi Smoothed Oscillator
Instead of using the "regular" Heiken Ashi for oscillator calculations, this version is using the smoothed Heiken Ashi. That makes the number of false signals fall dramatically, and, when pre-smoothing is applied to Heiken Ashi, the lag is in acceptable bounds.
Fractal dimension - Ehlers
By it's nature, fractal dimension index indicator is not directional. Instead it is showing if there is a trend or not. If the value of the FDI is less than the target threshold, then there is no trend (the market is ranging). If the value is above that threshold then the market is trending.
Fractal dimension index (Sevcik/Matulich)
Mandelbrot describes the Fractal Dimension Index (FDI) as a way to measure "how convoluted and irregular" something is. The FDI can be used as a stock market indicator. The closer prices move in a one-dimensional straight line, the closer the FDI moves to 1.0. The more closely prices resemble a two-dimensional plane, the closer the FDI moves to 2.0.