Join our fan page

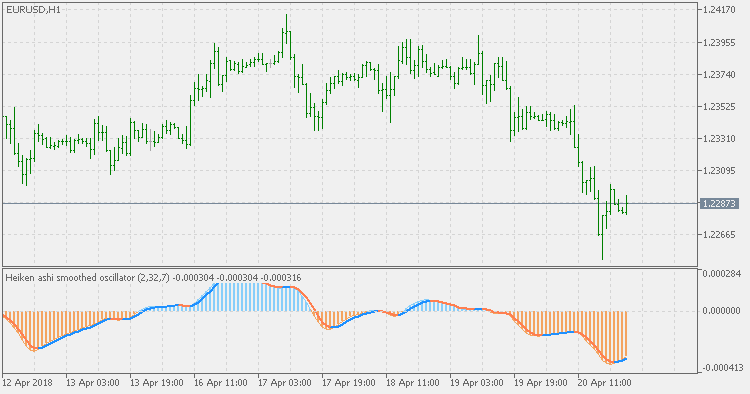
Heiken Ashi Smoothed Oscillator - indicator for MetaTrader 5

- Views:
- 14646
- Rating:
- Published:
- Updated:
-
 You are missing trading opportunities:
- Free trading apps
- Over 8,000 signals for copying
- Economic news for exploring financial markets
Registration Log inYou agree to website policy and terms of use
If you do not have an account, please register -
 Need a robot or indicator based on this code? Order it on Freelance
Go to Freelance
Need a robot or indicator based on this code? Order it on Freelance
Go to Freelance
Extending the Heiken Ashi Oscillator.
Heiken Ashi Oscillator tends to have a lot of signal. So many signals that sometimes it is impossible to use it reasonably in trading. This version is attempting to bring that into reasonable bounds.
Instead of using the "regular" Heiken Ashi for oscillator calculations, this version is using the smoothed Heiken Ashi. That makes the number of false signals fall dramatically, and, when pre-smoothing is applied to Heiken Ashi, the lag is in acceptable bounds. That way it becomes a good trend assessment tool. Along with a signal line, you have multiple choices how to use this indicator in trading.
Heiken Ashi Oscillator
Instead of using "pure price" this indicator uses Heiken Ashi values to determine the trend as well as the "strength" of the trend.
Stochastic volatility
This is not a directional indicator. This means that even it is stochastic it does not show the direction of the market, but shows the direction-amount-size of volatility. The assumption that seems sound enough and after which this indicator is made is that in the times of extremely low volatility it is a good time to enter the market, since the change in volatility is imminent. Those times are marked by dark gray dots on this indicator. For direction of entry, you should use some other trend showing indicator(s).
Weekly Fibo Levels
Calculation is based on current week open and previous week range.
BB MACD Extended
BB MACD is a MACD (Moving Average Convergence Divergence) indicator variation with an addition of Bollinger Bands, which helps in detecting trend change points and measuring current trend's strength.