Join our fan page

ZigZag separate - indicator for MetaTrader 5

- Views:
- 13190
- Rating:
- Published:
- Updated:
-
 You are missing trading opportunities:
- Free trading apps
- Over 8,000 signals for copying
- Economic news for exploring financial markets
Registration Log inYou agree to website policy and terms of use
If you do not have an account, please register -
 Need a robot or indicator based on this code? Order it on Freelance
Go to Freelance
Need a robot or indicator based on this code? Order it on Freelance
Go to Freelance
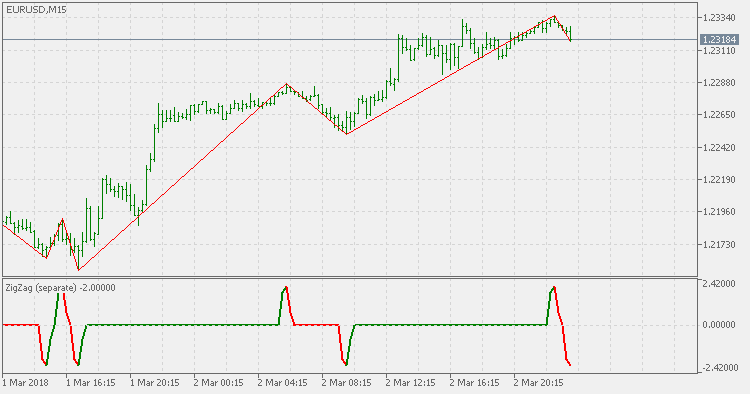
This is a MetaTrader 5 version of one indicator that was floating around the net as a wonder indicator for MetaTrader 4.
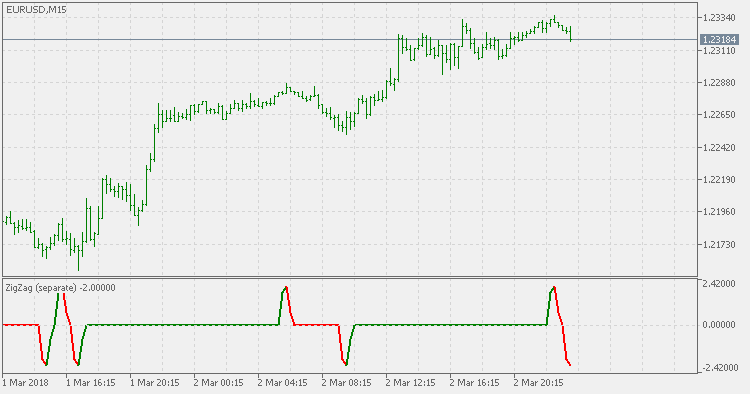
It is not a matter if it is useful or not (ZigZag is, in my opinion a useful indicator), but a matter of avoiding misuse of the indicator and presenting it as something it is not. Regardless of the completely different look than the ZigZag indicator, that is a ZigZag indicator as it can be seen on the parallel display too.
PS: always keep in mind that this is actually a ZigZag indicator - it should not be used in signaling mode.
Fractal Adaptive MACD
Fractal Adaptive Moving Average Technical Indicator (FRAMA) was developed by John Ehlers. This indicator is constructed based on the algorithm of the Exponential Moving Average, in which the smoothing factor is calculated based on the current fractal dimension of the price series. The advantage of FRAMA is the possibility to follow strong trend movements and to sufficiently slow down at the moments of price consolidation.
Instantaneous Trend Line bands (generalized)
This version extends the Instantaneous Trend Line indicator with a sort of bands to make it easier to spot trend change and to filter out some false signals that can be produced if only the slope of the ITL indicator is takes for a signal. And it also differs from the original in one important part: instead of using fractional alpha parameter for calculation, this version uses period which makes it the same category as averages are and the usage becomes a bit more intuitive than the original version.
Chande's DMI (Dynamic Momentum Index)
The Dynamic Momentum Index (DMI) is a variable term RSI. When default values are used, the RSI term varies from 3 to 30. The variable time period makes the RSI more responsive to short-term moves. The more volatile the price is, the shorter the time period is. It is interpreted in the same way as the RSI, but provides signals earlier.
3 MAs Market
Indicator that shows the current estimated state of the market based on a correlation of 3 Moving Averages.