Join our fan page
- Views:
- 100495
- Rating:
- Published:
- Updated:
-
 You are missing trading opportunities:
- Free trading apps
- Over 8,000 signals for copying
- Economic news for exploring financial markets
Registration Log inYou agree to website policy and terms of use
If you do not have an account, please register -
 Need a robot or indicator based on this code? Order it on Freelance
Go to Freelance
Need a robot or indicator based on this code? Order it on Freelance
Go to Freelance
Contents
- GENERAL PROVISIONS
- ANALYSIS OF 'COMMITMENTS OF TRADERS'(COT)
- ANALYSIS OF 'DISAGGREGATED COT' (D-COT)
- ANALYSIS OF 'TRADERS IN FINANCIAL FUTURES' (TFF)
- ANALYSIS OF 'LARGEST TRADERS COT' (L-COT)
- ANALYSIS OF 'COMMODITY INDEX TRADER SUPPLEMENT' (CIT)
General provisions
Brief description
MetaCOT 2 CFTC ToolBox Indicators is a set of indicators analyzing CFTC reports (US Commodity Futures Trading Commission) and allowing you to plot COT, D-COT, TFF and CIT charts directly in the MetaTrader platform. These indicators are available in the source codes, however, their work requires special libraries MetaCOT 2 CFTC MT4 ToolBox.
MetaCOT 2 CFTC ToolBox supports the following types of CFTC reports:
- COT - Commitments of Traders. This is a standard type of reports that has the greatest depth of history, since 1989. This type of report comes out for a wide range of futures, including commodity futures (commodities), currency futures (currencies), futures on energy (gas, oil), financial futures (bonds, indexes) and other derivatives. It is made in two versions: with the option positions of the participants (futures and option) and excluding option positions (futures only).
- D-COT - Dissagregated COT. This type of reports is an advanced representation of COT reports. It includes more specific groups of traders. Reports of this type are published since 2011 and are available only for commodity futures markets (commodities, gas, oil, metals). It is made in two versions: with the option positions of the participants (futures and option) and excluding option positions (futures only).
- TFF - Traders in Financial Futures. This type of reporting is analogous to D-COT designed for financial futures. It divides market participants into more specific groups of traders as compared to the standard COT report. Also, like other reports, it is available in two versions: with the option positions of the participants (futures and option) and excluding option positions (futures only).
- CIT - Commodity Index Trader Supplement. Report of the index commodity traders' sentiment. A specific kind of report, reminiscent of the classic COT report, but it includes the positions of index traders. This type of report takes into account the option positions of traders.
- LRGST - Largest Positions. COT reports that, apart of data on the positions of traders, also contain additional data about the positions of the major market participants as a percentage of open interest (the total number of open contracts). These data are not a separate type of report. It has a different structure and analyzed in MetaCOT 2 as a separate report type.
For each of the supported report types, the following indicators are plotted:
- Absolute Position - absolute positions of market participants. The basic data type for all indicators. It is a basis of all other indicators, such as the net positions of the group of traders or COT Index.
- Absolute Changes - weekly changes in net positions of traders. This value contains in all of the report types in the 'Changes in Commitments' column. The indicator allows you to count the changes for any number of weeks, as well as provides results in the form of net changes in contracts and in the form of percentage changes.
- Netto Positions - displays the net positions of traders. Available for all report types. Based on MetaCOT 2 absolute position.
- Netto Changes - similar to MetaCOT 2 Absolute Changes, it only calculates changes in net positions of traders. The indicator allows you to count the changes for any number of weeks, as well as provides results in the form of net changes in contracts and in the form of percentage changes.
- COT Index - classic oscillator that shows their values range from 0 to 100. Values from 0 to 20 and 80 to 100 are considered extreme and indicate a possible change in trend. For each report type, this indicator is called differently: 'COT Index' for the COT reports. 'D-COT Index' for Dissagregated COT, 'TFF Index' for TFF, 'CIT-Index' for CIT reports.
- Willco - Williams Commercial Index - Williams' commercial index. This indicator was proposed by Larry Williams and is a more advanced modification of the COT Index. It takes into account not only the historical levels of the group's position traders, but also compares them with the general market volume (open interest). Thus, obtained values are more accurate and not subject to the fluctuations inherent in a thin, illiquid market. This indicator is also required on the estimated futures markets, since at the time of expiration, positions are eliminated raising the need for considering the total open interest.
- Movement Index - calculated based on the COT Index or Willco. It is a simple difference between the current value of the COT Index and the same value 6 weeks ago (the default value). It indicates a strong change in the market participants' sentiments often forecasting the market reversals. Extreme values for this indicator are considered to be values greater than 40% by the module, but you can set other threshold levels.
For each CFTC report, there are 7 main indicators, while each indicator exists in 5 versions depending on a report type. Below is the table that shows the correspondence between the indicator and the report type. For some versions of indicators, a separate build is available on the Market. In this case, the name of the indicator contains a link to a separate version. Otherwise, this indicator is only available as part of this library:
| Indicator \ Report type | Commitments of Traders (COT) | Dissagregated COT (D-COT) | Traders in Financial Futures (TFF) | Commodity Index Trader Supplement (CIT) | Largest Positions (LRGST) |
|---|---|---|---|---|---|
| COT Index | MetaCOT 2 COT Index | MetaCOT 2 DCOT Index | MetaCOT 2 TFF Index | MetaCOT 2 CIT Index | - |
| Williams Commercial Index (Willco) | MetaCOT 2 Williams Commercial Index COT | MetaCOT 2 Williams Commercial Index D-COT | MetaCOT 2 Williams Commercial Index TFF | MetaCOT 2 Williams Commercial Index CIT | MetaCOT 2 Williams Commercial Index LCOT |
| Movement Index | MetaCOT 2 Movement Index | MetaCOT 2 Movement Index DCOT | MetaCOT 2 Movement Index TFF | MetaCOT2 Movement Index CIT | MetaCOT 2 Movement Index LCOT |
| Netto Positions | MetaCOT 2 Netto Position COT | MetaCOT 2 Netto Position DCOT | MetaCOT 2 Netto Position TFF | MetaCOT Netto Position CIT | MetaCOT 2 Netto Position LCOT |
| Netto Changes | MetaCOT 2 Netto Changes COT | MetaCOT 2 Netto Changes DCOT | MetaCOT 2 Netto Changes COT | MetaCOT 2 Netto Changes CIT | MetaCOT 2 Netto Changes LCOT |
| Absolute Positions | MetaCOT 2 Absolute Positions COT | MetaCOT 2 Absolute Positions DCOT | MetaCOT 2 Absolute Positions TFF | MetaCOT 2 Absolute Positions CIT | MetaCOT 2 Absolute Positions LCOT |
| Absolute Changes | MetaCOT 2 Absolute Changes COT | MetaCOT 2 Absolute Changes DCOT | MetaCOT 2 Absolute Changes TFF | MetaCOT 2 Absolute Changes CIT | MetaCOT 2 Absolute Changes LCOT |
Installing the libraries and indicators
For installation and proper operation of indicators, follow these steps:
- Download a special tool to install and update reports MetaCOT 2 Install CFTC Reports MT4;
- With its help, install the reports to your computer. You can find the details on installing and working with the tool in a special blog (in Russian).
- Once all reports are installed, download and install a special data provider: MetaCOT 2 CFTC ToolBox Demo MT4. This library interacts with a database downloaded with the help of MetaCOT 2 Install CFTC Reports and provides access to the original CFTC data. This is the free version of the fully functional library: MetaCOT 2 CFTC ToolBox MT4. It provides the data with some delay.
- Place all the files attached to this page according to their location.
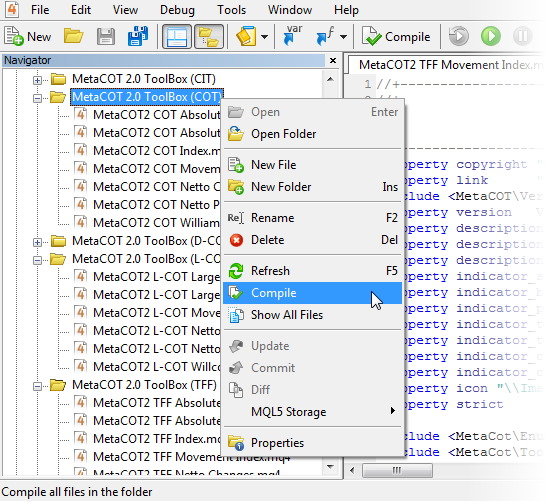
- Compile all indicators by selecting each folder with MetaCOT indicators in MetaEditor and clicking the "Compile" in the context menu:
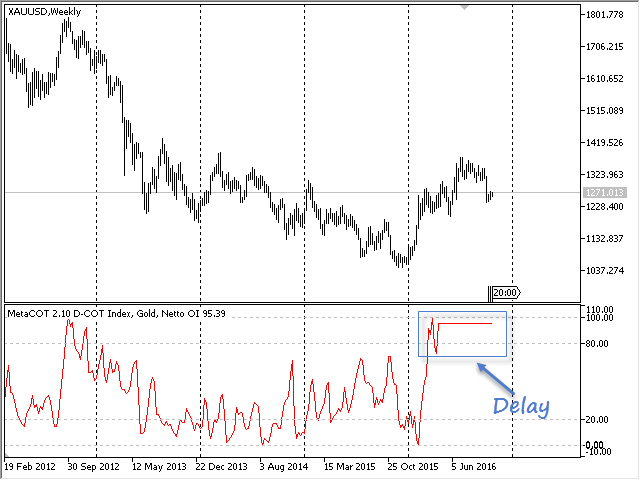
After compilation, MetaCot 2 indicators appear in MetaTrader. You can run them on the chart. The data is displayed with some delay:
Remove the delay by installing the fully functional version of the library: MetaCOT CFTC MT4 ToolBox. Then perform one of two actions:
- Option 1: Use the file MQL4\Include\MetaCOT\VersionFull.mqh instead of MQL4\Include\MetaCOT\Version.mqh. To do this, delete Version.mqh and rename VersionFull.mqh to Version.mqh, or simply replace the contents of Version.mqh to VersionFull.mqh
- Option 2: Open the Version.mqh file in MetaEditor. Comment the line #define METACOT_DEMO by putting two slashes at its beginning:
//| Version.mqh |
//| Copyright 2016, Vasiliy Sokolov |
//| https://www.mql5.com/en/users/c-4 |
//+------------------------------------------------------------------+
#define VERSION "2.11"
//#define METACOT_DEMO
#define METACOT_TOOLBOX
//+------------------------------------------------------------------+
//| Version of MetaCOT 2.0 |
//+------------------------------------------------------------------+
double Version(void)
{
double ver = StringToDouble(VERSION);
return ver;
}
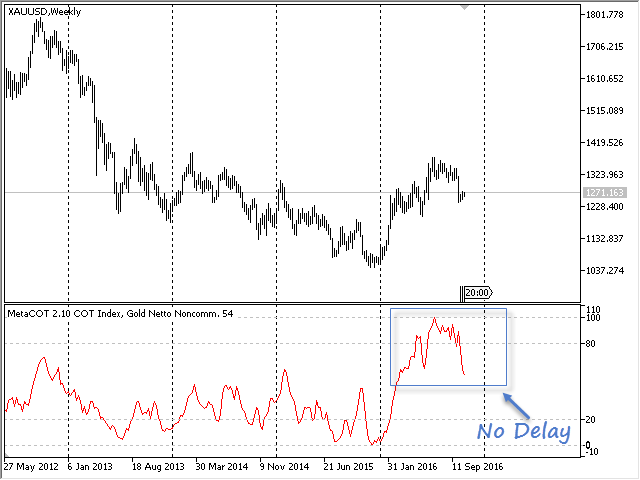
After all the changes, recompile all the indicators again. To do this, repeat the point 5 of the installation procedure. Restart indicators. If done correctly, delays should disappear:
If for any reason, you are unable to upgrade to the full featured version, please contact me via the private messaging system: https://www.mql5.com/en/users/c-4
Several indicators in one window
All indicators of MetaCOT series designed in such a way that allows you to combine your data in one window and work with standard indicators. Besides, the following features are available apart from the standard functionality:
- Several indicators can be displayed in one subwindow of the main chart;
- Data for each indicator can serve as a basis for calculation of other standard indicators.
For example, we will create two COT indices in one window and calculate the moving average for one of them:
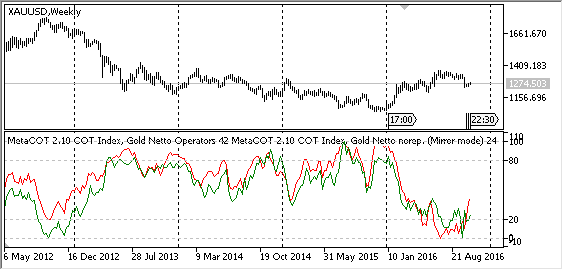
- Move COT-Index on the chart of gold using Drag-n-Drop. Run it with default parameters:
- Move using Drag-n-Drop again, the indicator COT-Index on the chart of gold, in the region of the indicator, which was already built. Before running it, let's replace a group of traders with the net positions of unreported traders (Netto Nonreportable). Set Mirror mode to true. Choose green for the color. After the launch, we should get the following picture:
- Now also use Drag-n-Drop to move the standard Moving Average to the first indicator plotting area. Select a dotted line as a plotting style. Select the "First Indicator's Data" as properties in the "Apply to" form. After the launch, the moving average will be calculated on the very COT index and displayed in the indicator window as a red dotted line:
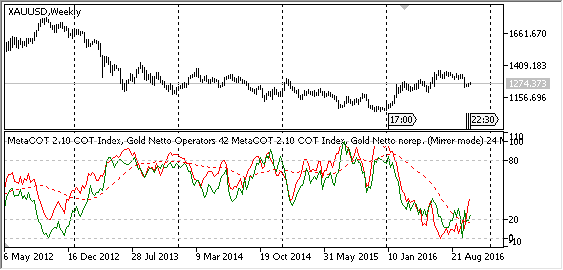
Similarly, you can build other standard indicators using the MetaCOT data.
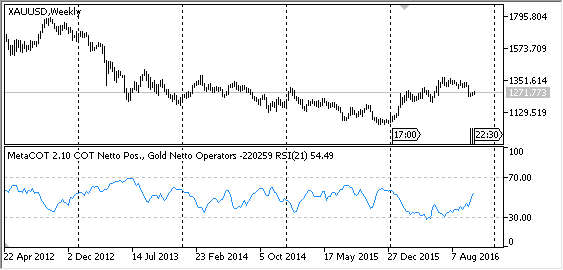
The RSI built on the net positions of operators of MetaCOT COT Netto Positions:
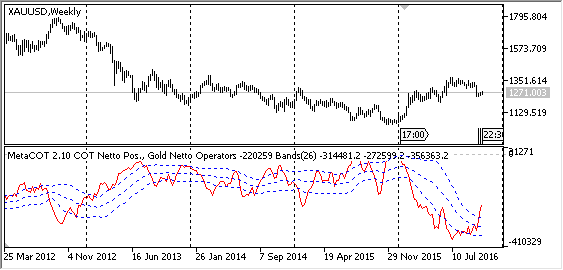
The Bollinger Bands based on net positions of operators of MetaCOT COT Netto Positions (dotted channel):
Get acquainted with the way of displaying multiple indicators in a single window in the following video:
Exporting CFTC reports to CSV format and Excel
In addition to the indicators, MetaCOT 2 CFTC ToolBox provides the ability to export any data from any report in a text CSV file. This file then can be uploaded to a program for processing statistical information, for example Excel. Saving data to a file is performed by a special script MetaCOT 2 Indicators Save Values In File. It receives the value of one of the 34 MetaCOT indicators, and then saves them in a text file in CSV format. This utility has the following main parameters:
- Type of CFTC Indicator - one of the 34 MetaCOT indicators whose values should be saved;
- Period (if used) - period of the indicator, if the indicator actually uses a period. For indicators which do not use period, for example for a COT Absolute Position, this parameter is ignored;
- Movement period (if used) - this parameter is used by Movement Index indicator, and indicators of changes (Absolute Changes and net Changes), which corresponds to the Difference Between the Two Reports. It shows the number of weeks between the current and the previous report. If the indicators (such as COT Index and Netto Position) do not use this parameter, it is ignored;
- Type of Mov.Index (if used) - type of Movement Index indicator. Only used in the Movement Index indicators.
Let's consider the practical problem: exporting COT-Index in Excel for further analysis:
- Run the script Save the File In Indicators Values on the chart of a symbol you need;
- Select 'COT Index' in the 'Type of CFTC Indicator' parameter. The parameter 'Period' is left unchanged (equal to 52 weeks);
- Click 'OK'. In the working directory (MetaCOT\CsvReport), a new file appears with the report and indicator name:
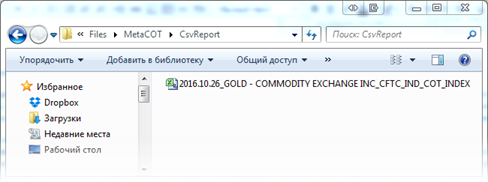
(The folder location, where you are able to find the required file, corresponds approximately to the following: C:\Users\UserName\AppData\Roaming\MetaQuotes\Terminal\Common\Files\MetaCOT\CsvReport where UserName is your name in Windows OS).
Start Excel. Export a CSV file by selecting the Data tab and clicking the "From text" icon. The export wizard is launched. Choose the previously saved file. Specify a semicolon as a separator of columns.
If done correctly, the values of the 52 week COT Index should appear in the table:
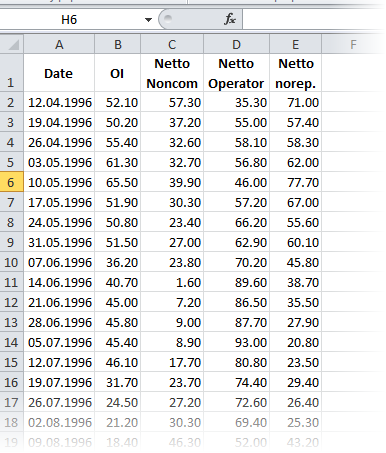
The script saves all groups of participants in the corresponding columns simultaneously. Similarly, you can export to Excel any report CFTC as well as any indicator built on the basis of a report. For example, if you want to analyze the absolute position of the participants of the COT, select the CFTC COT Absolute Position in Type of CFTC Indicator and save the result.
The video below shows an example of data export net positions (Netto Position) members of COT in Excel:
For programmers
All indicators are based on the same algorithm:
- Filling a special structure CotBaseSettings for the formation of request data;
- Download the underlying report data through the library MetaCOT 2 CFTC ToolBox in the form of two arrays: date - value (datetime, double);
- The calculation of the indicator values based on the underlying data. All calculation algorithms are located in MetaCOT 2 CFTC ToolBox.mqh;
- Synchronization of calculated values with the current chart and data display on the chart.
Let us consider an example on the basis of MetaCOT 2 COT Index:
//| MetaCOT 2.0 - СOT Index.mq5 |
//| Copyright 2015, Vasiliy Sokolov. |
//| https://www.mql5.com |
//+------------------------------------------------------------------+
#property copyright "MetaCOT® 2009-2016, Vasiliy Sokolov, St.-Petersburg, Russia"
#property link "https://www.mql5.com/en/articles/1573"
#include <MetaCOT\Version.mqh>
#property version VERSION
#property description "MetaCOT 2 is designed for analize CFTC reports, data mining and for fundamental analysis."
#property description "See article 'MetaCOT Project - New horizons for CFTC report analysis in MetaTrader 4'"
#property description "\nFor work this indicator need download and install 'MetaCOT - Install CFTC reports' tool."
#property indicator_separate_window
#property indicator_buffers 1
#property indicator_plots 1
#property indicator_type1 DRAW_LINE
#property indicator_color1 clrRed
#property indicator_minimum -10
#property indicator_maximum 110
#property indicator_level1 0;
#property indicator_level2 20;
#property indicator_level3 80;
#property indicator_level4 100;
#property icon "\\Images\\MetaCOT\\MetaCOT COT Index.ico"
#property strict
#include <MetaCOT\ToolBox.mqh>
const ENUM_CFTC_REPORT ReportType = CFTC_COT;
CftcReportInfo ReportInfo;
input ENUM_COT_SOURCE Source = FUTURES_AND_OPTIONS; // Source of Report
input ENUM_COT_NETTO_GROUP Group = COT_NETTO_OPERATORS; // Netto Group of Traders
input int CotPeriod = 52; // Period of COT Index
input string ProffSettings = ""; // # PROFESSIONAL SETTINGS: #
input ENUM_COT_RELEASE_DAY ReleaseDay = COT_RELEASE_FRIDAY; // Release Day
input ENUM_COT_DATA_TYPE DateType = COT_DATA_FUTURES; // Data Type
input ENUM_COT_SUBGROUP SubGroup = COT_SUBGROUP_ALL; // Subgroup of Traders
input bool AutoDetectReport = true; // Auto Detect Report Name
input string LoadReportName =
"WHEAT-SRW - CHICAGO BOARD OF TRADE"; // Report Name (If Auto Detect=false)
input bool Mirror = false; // Mirror Mode
double cot_values[];
ENUM_LICENSE_TYPE LicenseType;
int Sign = 1;
double cvalues[];
datetime ctimes[];
int cindex = 0;
int prev_total = 0;
//+------------------------------------------------------------------+
//| Custom indicator initialization function |
//+------------------------------------------------------------------+
int OnInit()
{
Sign = Mirror ? -1 : 1;
EventSetTimer(5);
SetIndexBuffer(0, cot_values, INDICATOR_DATA);
IndicatorSetInteger(INDICATOR_DIGITS, 0);
// Configurable structure CotBaseSettings to obtain the desired data type
CotBaseSettings settings;
settings.source = Source;
settings.subgroup = SubGroup;
settings.report_name = ReportInfo.report_name;
settings.date_type = DateType;
settings.release_day = ReleaseDay;
settings.report_name = ReportInfo.report_name;
string mmode = Mirror ? " (Mirror mode)" : "";
IndicatorSetString(INDICATOR_SHORTNAME, MC_LABEL + " COT Index, " + ReportInfo.short_name + " " + EnumCotNetGroupToString(Group) + mmode);
// The obtained values of the indicator
GetCotIndexValues(settings, CotPeriod, Group, ctimes, cvalues);
return(INIT_SUCCEEDED);
}
int OnCalculate (const int rates_total, // size of the input time series
const int prev_calculated, // bars processed during the previous call
const datetime& time[], // Time
const double& open[], // Open
const double& high[], // High
const double& low[], // Low
const double& close[], // Close
const long& tick_volume[], // Tick Volume
const long& volume[], // Real Volume
const int& spread[] // Spread
)
{
int total = ArraySize(cvalues);
if(total == 0)
return rates_total;
if(prev_calculated == 0)
cindex = 0;
ArraySetAsSeries(cot_values, false);
ArraySetAsSeries(time, false);
int limit = prev_calculated;
//Full recalculation in case new data is downloaded
if(total != prev_total)
{
limit = 0;
cindex = 0;
prev_total = total;
}
// Performed by synchronizing values with the current schedule
for(int i = limit; i < rates_total; i++)
{
if(ctimes[cindex] > time[i])
{
cot_values[i] = EMPTY_VALUE;
continue;
}
while(cindex+1 < total && time[i] >= ctimes[cindex+1])
cindex++;
if(!Mirror)
cot_values[i] = cvalues[cindex];
else
cot_values[i] = 100.0 - cvalues[cindex];
}
return rates_total-1;
}
Let us examine in detail how the calculation of the COT index is performed. It is calculated in two stages:
- The net position of one of the groups of a COT report.
- Calculating the COT index based on the received data:
//| Get COT-Index values of COT report |
//| settings - base settings of cftc report |
//| group - group of trades |
//| times - time values of data |
//| values - group values |
//+------------------------------------------------------------------+
bool GetCotIndexValues(CotBaseSettings& settings, int period, ENUM_COT_NETTO_GROUP group, datetime& times[], double& values[])
{
// The resulting net position of one of the groups of the COT report
double netto_values[];
if(!GetCotNettoValues(settings, group, times, netto_values))
return false;
// Calculate the universal COT index on the obtained net positions
return GetIndexValues(period, netto_values, values);
}
Calculating the COT index is represented by the GetIndexValues function (ToolBox.mqh file):
//| Calculate COT index on double array 'src_values' |
//| period - Period of COT Index |
//| src_values - Source double values |
//| ind_values - Values of COT Index |
//+------------------------------------------------------------------+
bool GetIndexValues(int period, double& src_values[], double& ind_values[])
{
double max, min, index, curr;
int imax, imin, total = ArraySize(src_values);
ArrayResize(ind_values, ArraySize(src_values));
ArrayInitialize(ind_values, EMPTY_VALUE);
for(int i = period-1; i < total; i++)
{
imax = ArrayMaximum(src_values, i-period+1, i);
imin = ArrayMinimum(src_values, i-period+1, i);
max = src_values[imax];
min = src_values[imin];
curr = src_values[i];
if(max-min != 0.0)
index = ((curr-min)/(max-min))*100.0;
else
index = 100.0;
ind_values[i] = index;
}
return ArraySize(ind_values)>0;
}
All other indicators of the MetaCOT2 series work the same way.
Analysis of 'Commitments of Traders' (COT) reports
MetaCOT 2 COT Absolute Position
The indicator of absolute positions shows the dynamics of the open positions or the number of traders in each participant groups of the classic COT report (Commitments of Traders). It includes the following groups:
- Cumulative Open Interest of all market participants (Open Interest);
- Long position or the number of non-commercial traders (Non-Commercial Long);
- Short position or the number of non-commercial traders (Non-Commercial Short);
- Position of non-commercial traders or their number, that is covered (Non-Commercial Spread);
- Long position or the number of operators (Operators Long);
- Short position or the number of operators (Operators Short);
- Long position of non-reportable or small traders (Nonreportable Long);
- Short position of non-reportable or small traders (Nonreportable Short).
Below are the based indicator parameters and their description:
- Source of Report - COT report type. There are two types of report: 'Futures Only' and 'Futures And Options';
- Group of Traders - Group of COT report participants. Includes the groups listed above;
More details on the description of the indicator settings can be found in the blog "MetaCOT 2: Settings and Possibility".
Often the extreme values of one of the group members are the harbingers of the global market reversal. This indicator shows these values, indicating the potential reversals in the future. Find out more details on how to use this indicator in the book by Larry Williams: "Trade Stocks and Commodities with the Insiders: Secrets of the COT Report", and also in the article Meta COT Project - New Horizons for CFTC Report Analysis in MetaTrader 4.

Chart of COT report: absolute positions of the participants
MetaCOT 2 COT Absolute Changes
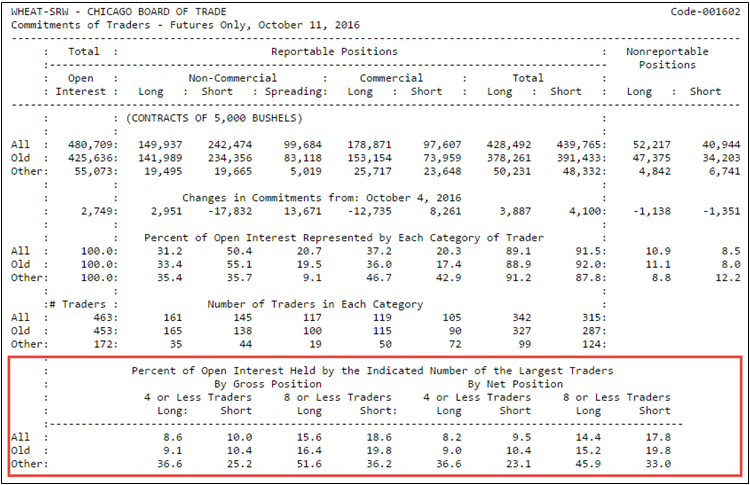
MetaCOT 2 Absolute Changes in Commitments shows the changes in the number of contracts held by the market participants. The information on the market participants and the number of contracts held by them is obtained from the COT reports, published by the CFTC (U.S. Commodity Futures Trading Commission). The data displayed by the indicator is available in the COT report itself, in the "Changes in Commitments" section:

The COT report: source format of the report
Below are the indicator parameters and their descriptions:
- Source of Report - COT report type. There are two types of report: 'Futures Only' and 'Futures And Options';
- Group of Traders - Group of COT report participants. Includes the open interest, long and short side of the non-commercial traders, operators and non-reportable traders;
- Difference Between Two Reports- The default value of 1 means that it will calculate the difference between the current and the value one week ago. The value of 2 means the difference between the current value and the value two weeks ago, etc.
- Type Values - The 'Absolute Values' means the display of the absolute changes in the number of contracts. The 'Percent Values' displays this change as a percentage of the previous value.
More details on the description of the indicator settings can be found in the blog "MetaCOT 2: Settings and Possibility".
This indicator can be combined with other indicators of the MetaCOT series, also to display several participant groups in one common subwindow of the indicator. This achieves a high degree of flexibility in conducting fundamental and technical market analysis. It is important to understand that this indicator is best used in conjunction with other indicators of the MetaCOT series, thereby producing the most accurate and comprehensive analysis of the fundamental picture of the market.

Chart of COT report: changes in absolute positions
MetaCOT 2 COT Netto Position
MetaCOT 2 is a set of indicators and specialized utilities for the analysis of the U.S. Commodity Futures Trading Commission reports. Thanks to the reports issued by the Commission, it is possible to analyze the size and direction of the positions of the major market participants, which brings the long-term price prediction accuracy to a new higher-quality level, inaccessible to most traders.
The indicator of the net positions of the market participants displays the difference between the long and short positions of one of the three trader groups, and also the gross open interest of the entire market and the number of positions that are covered by non-commercial traders. The COT (Commitments of Traders) report of the CFTC commission serves as the data source for this indicator. Below is a complete list of displayed groups:
- Cumulative Open Interest of all market participants (Open Interest);
- Net position of non-commercial traders (Netto Non-Commercial);
- Position of non-commercial traders, that is covered (Non-Commercial Spread);
- Net position of operators or commercial traders (Netto Operators Long);
- Net position of non-reportable or small traders (Nonreportable Long);
Often the extreme values of the net position of one of the group members are the harbingers of the global market reversal. This indicator shows these values, indicating the potential reversals in the future. Find out more details on how to use this indicator in the book by Larry Williams:"Trade Stocks and Commodities with the Insiders: Secrets of the COT Report", and also in the articleMeta COT Project - New Horizons for CFTC Report Analysis in MetaTrader 4.
Below are the indicator parameters and their description:
- Source of Report - COT report type. There are two types of report: 'Futures Only' and 'Futures And Options';
- Group of Traders - Group of COT report participants. Includes the groups listed above;
More details on the description of the indicator settings can be found in the blog "MetaCOT 2: Settings and Possibility".

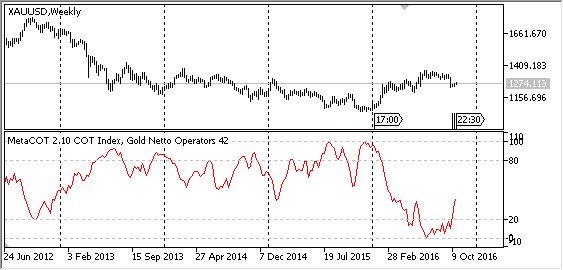
Chart of COT report: net positions of participants
MetaCOT 2 COT Netto Changes
MetaCOT 2 Netto Changes in Commitments shows the changes in the net positions of market participants. The information on the market participants and the number of contracts held by them is obtained from the COT reports, published by the CFTC (U.S. Commodity Futures Trading Commission). The indicator data is similar to the values given in the "Changes in Commitments" section of the COT report, with the only difference that they are calculated for the net position and not the absolute position of the traders. In addition, the presented indicator has additional features:
- The changes in the number of contracts can be viewed not only compared to the previous week's publication, but also to any other previous date of the report (set by the 'Difference Between Two Reports' parameter);
- The changes can be displayed not only as the absolute change in the contracts, but also as their percentages (set by the 'Type Values' parameter).
Below are the indicator parameters and their descriptions:
- Source of Report - COT report type. There are two types of report: 'Futures Only' and 'Futures And Options';
- Netto Group of Traders - Net group of COT report participants. Includes the open interest and the total position of one of three groups (non-commercial traders, operators and non-reportable traders);
- Difference Between Two Reports- The default value of 1 means that it will calculate the difference between the current and the value one week ago. The value of 2 means the difference between the current value and the value two weeks ago, etc.
- Type Values - The 'Absolute Values' means the display of the absolute changes in the number of contracts. The 'Percent Values' displays this change as a percentage of the previous value.
More details on the description of the indicator settings can be found in the blog "MetaCOT 2: Settings and Possibility".

Chart of COT report: changes in net position
MetaCOT 2 COT Index
COT Index is the most popular, efficient and the simplest indicator for determining the extreme overbought and oversold points of the market. It is calculated on the basis of data on the net trader positions taken from the COT report (Commitments of Traders) by the Stochastic oscillator formula. The values of the indicator from 0% to 20% and from 80% to 100% point at the moments of the extreme overbought and oversold state market, signaling the frequent reversal of the price after reaching these levels. The calculation is based on net positions of commercial, non-commercial and non-reportable traders, as well as the open interest.
Find out more details on the usage methods of this indicator in the book by Larry Williams:Trade Stocks and Commodities with the Insiders: Secrets of the COT Report", and also in the articleMeta COT Project - New Horizons for CFTC Report Analysis in MetaTrader 4.
Below are the indicator parameters and their description:
- Source of Report - COT report type. There are two types of report: 'Futures Only' and 'Futures And Options';
- Group of Traders - Group of COT report participants. Includes the groups listed above;
- Period of COT Index - Period of COT Index calculation. Recommended values: 25, 52 and 156 weeks;
More details on the description of the indicator settings can be found in the blog "MetaCOT 2: Settings and Possibility".

Graph of COT Index (52 weekly, Gold)
MetaCOT 2 COT Williams Commercial Index (Willco)
Williams Commercial Index (Willco) developed by Larry Williams is the most advanced version of the standard COT Index. Unlike the latter, Willco compares extreme values of participant groups to cumulative open interest. Thus, Willco is a standard COT Index weighted relative to the entire market. Like the latter, it is an oscillator and changes its value from zero to one hundred percent. The values of the indicator from 0% to 20% and from 80% to 100% point at the moments of the extreme overbought and oversold state market, signaling the frequent reversal of the price after reaching these levels. The data on net positions of traders is used as the basis of the calculation (see the MetaCOT 2 Netto Positionsindicator).
Find out more details on the usage methods of this indicator in the book by Larry Williams: Trade Stocks and Commodities with the Insiders: Secrets of the COT Report", and also in the article Meta COT Project - New Horizons for CFTC Report Analysis in MetaTrader 4.
Below are the indicator parameters and their description:
- Source of Report - COT report type. There are two types of report: 'Futures Only' and 'Futures And Options';
- Group of Traders - Group of COT report participants. Includes the groups listed above;
- Period of COT Index - period of COT Index calculation. Recommended values: 25, 52 and 156 weeks;
More details on the description of the indicator settings can be found in the blog "MetaCOT 2: Settings and Possibility".

Graph of Willco (52 weekly, Gold)
MetaCOT 2 COT Movement Index
Movement Index was first proposed by Steve Breeze and described in his book "The Commitments of Traders Bible: How To Profit from Insider Market Intelligence". It quickly gained popularity among the traders who analyze the CFTC reports, and became a classic and a unique tool in many aspects, which can be used for finding rapid changes, leading to an imbalance of positions between the market participants.
The indicator displays the change in the relative position of the participants as a histogram, expressed as a percentage. It ranges from -100% to + 100% and is calculated based on the data of the COT Index or Willco Index indicator. The reverse signals appear when the absolute values of the indicator exceed the threshold, set to 40% by default.
While other indicators of the MetaCOT series are trend indicators, the Movement Index is a momentum indicator, i.e. it displays the rapid change in the positions of the market participants. Thus, the indicator becomes indispensable for analysis in conjunction with other indicators of the MetaCOT series. In addition, the Movement Index is not available on other programs which provide access to the CFTC reports. Thus, the MetaTrader platform and the MetaCOT set are the uncontested solution for the comprehensive analysis of the CFTC reports.
Find out more details on the usage methods of this indicator in the book by Larry Williams: Trade Stocks and Commodities with the Insiders: Secrets of the COT Report", and also in the article Meta COT Project - New Horizons for CFTC Report Analysis in MetaTrader 4.
Below are the main indicator parameters and their description:
- Source of Report - COT report type. There are two types of report: 'Futures Only' and 'Futures And Options';
- Group of Traders - Group of COT report participants. Includes the groups listed above;
- Calculation On Data - Allows to select one of two indicators as the data for calculation: COT Index (classic option) or Willco Index (advanced option);
- Period of COT Index - Period of COT Index calculation, the indicator used for the calculation of the Movement Index. Recommended values: 25, 52 and 156 weeks;
- Movement Period - the difference between the current COT Index value and the value N periods back.
More details on the description of the indicator settings can be found in the blog "MetaCOT 2: Settings and Possibility".

Graph of Movement Index (52 weekly, Gold)
Analysis of 'Disaggregated COT' (D-COT) reports
MetaCOT 2 D-COT Absolute Position
The absolute position indicator shows the dynamics of the open positions or the number of traders of each group of participants in the Disaggregated COT report. It includes the following groups:
- The total open interest of all market participants (Open Interest);
- Long position of the producers (Producer/Merchart/Processor/User Long);
- Short position of the producers (Producer/Merchart/Processor/User Short);
- The total long position of swap dealers (Swap Dealers Long);
- The total short position of swap dealers (Swap Dealers Short);
- The total position of swap dealers in the spreading (Swap Dealers Spreading);
- The total long position of money managers (Managed Money Long);
- The total short position of money managers (Managed Money Short);
- Total position money managers in the spreading (Managed Money Spreading);
- The total long position other reportable traders (Other Reportable Long);
- The total short position other reportable traders (Other Reportable Short);
- The total position other reportable traders in the spreading (Other Reportable Spreading);
- The total long position of unaccountable traders (Nonreportable Positions Long);
- The total short position of unaccountable traders (Nonreportable Positions Short);
Below are the main indicator parameters and their description:
- Source of Report - D-COT report type. There are two types of report: 'Futures Only' and 'Futures And Options';
- Group of Traders - Group of D-COT report participants. Includes the groups listed above;
More details on the description of the indicator settings can be found in the blog "MetaCOT 2: Settings and Possibility".
Often the extreme values of one of the group members are the harbingers of the global market reversal:

The Disaggregated COT report, the chart of the absolute positions of the participants
MetaCOT 2 D-COT Absolute Changes
MetaCOT 2 D-COT Absolute Changes shows the changes in the number of contracts held by the market participants. The information on the market participants and the number of contracts held by them is obtained from the D-COT reports, published by the CFTC (U.S. Commodity Futures Trading Commission). The data displayed by the indicator is available in the D-COT report itself, in the "Changes in Commitments" section:

The Disaggregated COT report, the original report format
In addition, the presented indicator has additional features:
- The changes in the number of contracts can be viewed not only compared to the previous week's publication, but also to any other previous date of the report (set by the 'Difference Between Two Reports' parameter);
- The changes can be displayed not only as the absolute change in the contracts, but also as their percentages (set by the 'Type Values' parameter).
Below are the indicator parameters and their descriptions:
- Source of Report - D-COT report type. There are two types of report: 'Futures Only' and 'Futures And Options';
- Netto Group of Traders - Net group of D-COT report participants. Includes the open interest and the total position of one of three groups (non-commercial traders, operators and non-reportable traders);
- Difference Between Two Reports- The default value of 1 means that it will calculate the difference between the current and the value one week ago. The value of 2 means the difference between the current value and the value two weeks ago, etc.
- Type Values - The 'Absolute Values' means the display of the absolute changes in the number of contracts. The 'Percent Values' displays this change as a percentage of the previous value.
More details on the description of the indicator settings can be found in the blog "MetaCOT 2: Settings and Possibility".

The Disaggregated COT report: change in the absolute position
MetaCOT 2 D-COT Netto Position
MetaCOT 2 D-COT Netto Position analyzes reports Disaggregated Commitments of Traders (D-COT) and is analogous to the classical indicator of the Netto Position calculated for the COT reports.
D-COT Netto Position - The indicator of the net positions of the market participants displays the difference between the long and short positions of one of the three trader groups, and also the gross open interest of the entire market.
Below are the indicator parameters and their description:
- Source of Report - COT report type. There are two types of report: 'Futures Only' and 'Futures And Options';
- Group of Traders - Group of COT report participants. Includes the groups listed above;
More details on the description of the indicator settings can be found in the blog "MetaCOT 2: Settings and Possibility".

The Disaggregated COT report, the chart of net position of participants
MetaCOT 2 D-COT Netto Changes
MetaCOT 2 D-COT Netto Changes shows the changes in the net positions of market participants. The information on the market participants and the number of contracts held by them is obtained from the D-COT reports, published by the CFTC (U.S. Commodity Futures Trading Commission). The indicator data is similar to the values given in the "Changes in Commitments" section of the D-COT report, with the only difference that they are calculated for the net position and not the absolute position of the traders. In addition, the presented indicator has additional features:
- The changes in the number of contracts can be viewed not only compared to the previous week's publication, but also to any other previous date of the report (set by the 'Difference Between Two Reports' parameter);
- The changes can be displayed not only as the absolute change in the contracts, but also as their percentages (set by the 'Type Values' parameter).
Below are the indicator parameters and their descriptions:
- Source of Report - D-COT report type. There are two types of report: 'Futures Only' and 'Futures And Options';
- Netto Group of Traders - Net group of D-COT report participants. Includes the open interest and the total position of one of three groups (non-commercial traders, operators and non-reportable traders);
- Difference Between Two Reports - The default value of 1 means that it will calculate the difference between the current and the value one week ago. The value of 2 means the difference between the current value and the value two weeks ago, etc.
- Type Values - The 'Absolute Values' means the display of the absolute changes in the number of contracts. The 'Percent Values' displays this change as a percentage of the previous value.
More details on the description of the indicator settings can be found in the blog "MetaCOT 2: Settings and Possibility".

The Disaggregated COT report, the chart of changes in the net positions of the participants
MetaCOT 2 D-COT Index
MetaCOT 2 is a set of indicators and specialized utilities, that allows to analyze the CFTC (U.S. Commodity futures trading commission) reports right in the MetaTrader terminal. This indicator analyzes the Disaggregated Commitments of Traders (D-COT) reports and is analogous to the classic COT Index indicator, calculated for the COT reports.
D-COT Index is the most popular, efficient and simple indicator for determining the extreme overbought and oversold points of the market. It is calculated based on the data on the net positions of traders from the D-COT (Disaggregated Commitments of Traders) report according to the formula of the Stochastic oscillator. The values of the indicator from 0% to 20% and from 80% to 100% point at the moments of the extreme overbought and oversold state market, signaling the frequent reversal of the price after reaching these levels.
Find out more details on the calculation method of this indicator in the book by Larry Williams: Trade Stocks and Commodities with the Insiders: Secrets of the COT Report".
Below are the main indicator parameters and their description:
- Source of Report - D-COT report type. There are two types of report: Futures Only and Futures And Options;
- Group of Traders - group of D-COT report participants;
- Period of COT Index - period of COT Index calculation. Recommended values: 26, 52 and 156 weeks;
More details on the description of the indicator settings can be found in the blog "MetaCOT 2: Settings and Possibility".
This indicator is designed for analyzing commodity markets (metals, oil and gas, food, raw materials). Use the TFF series indicators for analyzing the financial markets (currencies, indices, bonds), particularly the TFF Index.

Chart of Disaggregated COT Index (52 weekly , Gold)
MetaCOT 2 D-COT Williams Commercial Index (Willco)
MetaCOT 2 is a set of indicators and specialized utilities, that allows to analyze the CFTC (U.S. Commodity futures trading commission) reports right in the MetaTrader terminal. This indicator analyzes the Disaggregated Commitments of Traders (D-COT) reports and is analogous to the classic Willco indicator, calculated for the COT reports.
Williams Commercial Index (Willco) developed by Larry Williams is the most advanced version of the standard D-COT Index. Unlike the latter, Willco compares extreme values of participant groups to cumulative open interest. Thus, Willco is a standard D-COT Index weighted relative to the entire market. Like the latter, it is an oscillator and changes its value from zero to one hundred percent. The values of the indicator from 0% to 20% and from 80% to 100% point at the moments of the extreme overbought and oversold state market, signaling the potential reversal of the price after reaching these levels.
Find out more details on the calculation method of this indicator in the book by Larry Williams: Trade Stocks and Commodities with the Insiders: Secrets of the COT Report".
Below are the main indicator parameters and their description:
- Source of Report - D-COT report type. There are two types of report: Futures Only and Futures And Options;
- Group of Traders - group of D-COT report participants;
- Period of Willco Index - period of Willco Index calculation. Recommended values: 26, 52 and 156 weeks;
More details on the description of the indicator settings can be found in the blog "MetaCOT 2: Settings and Possibility".
This indicator is designed for analyzing commodity markets (metals, oil and gas, food, raw materials). Use the TFF series indicators for analyzing the financial markets (currencies, indices, bonds), particularly the Williams Commercial Index TFF.

Chart of Disaggregated Willco (52 weekly, Silver)
MetaCOT 2 D-COT Movement Index
Movement Index was first proposed by Steve Breeze and described in his book "The Commitments of Traders Bible: How To Profit from Insider Market Intelligence". It quickly gained popularity among the traders who analyze the CFTC reports, and became a classic and a unique tool in many aspects, which can be used for finding rapid changes, leading to an imbalance of positions between the market participants.
The indicator displays the change in the relative position of the participants as a histogram, expressed as a percentage. It ranges from -100% to + 100% and is calculated based on the data of the D-COT Index or D-COT Willco Index indicator. The reverse signals appear when the absolute values of the indicator exceed the threshold, set to 40% by default.
While other indicators of the MetaCOT series are trend indicators, the Movement Index is a momentum indicator, i.e. it displays the rapid change in the positions of the market participants. Thus, the indicator becomes indispensable for analysis in conjunction with other indicators of the MetaCOT series. In addition, the Movement Index is not available on other programs which provide access to the CFTC reports. Thus, the MetaTrader platform and the MetaCOT set are the uncontested solution for the comprehensive analysis of the CFTC reports.
Find out more details on the usage methods of this indicator in the book by Larry Williams: Trade Stocks and Commodities with the Insiders: Secrets of the COT Report", and also in the article Meta COT Project - New Horizons for CFTC Report Analysis in MetaTrader 4.
Below are the main indicator parameters and their description:
- Source of Report - D-COT report type. There are two types of report: 'Futures Only' and 'Futures And Options';
- Group of Traders - Group of D-COT report participants. Includes the groups listed above;
- Calculation On Data - Allows to select one of two indicators as the data for calculation: D-COT Index (classic option) or Willco Index (advanced option);
- Period of COT Index - Period of D-COT Index calculation, the indicator used for the calculation of the Movement Index. Recommended values: 25, 52 and 156 weeks;
- Movement Period - the difference between the current D-COT Index value and the value N periods back.
More details on the description of the indicator settings can be found in the blog "MetaCOT 2: Settings and Possibility".

Chart of Disaggregated Movement Index (52 weekly , Gold)
Analysis of 'Traders in Financial Futures' (TFF) reports
MetaCOT 2 TFF Absolute Position
The absolute position indicator shows the dynamics of the open positions or the number of traders of each group of participants report Traders in Financial Futures. It includes the following groups:
- The total open interest of all market participants (Open Interest);
- Long positions intermediaries, organizers of trades (Dealer/Intermediary Long);
- Short positions intermediaries, organizers of trades (Dealer/Intermediary Short);
- The position of the intermediaries, organizers in spreading (Dealer/Intermediary Spreading);
- Long positions of asset managers (Asset Manager Long);
- Short positions of asset managers (Asset Manager Long);
- The position of asset managers in the spreading (Spreading Asset Manager);
- The long position the leverage funds (Leverage Funds Long);
- The short position the leverage funds (Leverage Funds Short);
- The spreading position the leverage funds (Leverage Funds Spreading);
- The long position of other reportable traders (Other Reportable Long);
- The short position of other reportable traders (Other Reportable Short);
- The spreading position of other reportable traders (Other Reportable Spreading);
- Long positions nonreportable trades (Nonreportable Position Long);
- Short positions nonreportable trades (Nonreportable Position Long);
Below are the main indicator parameters and their description:
- Source of Report - TFF report type. There are two types of report: 'Futures Only' and 'Futures And Options';
- Group of Traders - Group of TFF report participants. Includes the groups listed above;
More details on the description of the indicator settings can be found in the blog "MetaCOT 2: Settings and Possibility".

The TFF report, the graph of the absolute positions of the dealers, the Russian ruble
MetaCOT 2 TFF Absolute Changes
MetaCOT 2 TFF Absolute Changes shows the changes in the number of contracts held by the market participants. The information on the market participants and the number of contracts held by them is obtained from the TFF report, published by the CFTC (U.S. Commodity Futures Trading Commission). The data displayed by the indicator is available in the TFF report itself, in the "Changes in Commitments" section:

The source report TFF
In addition, the presented indicator has additional features:
- The changes in the number of contracts can be viewed not only compared to the previous week's publication, but also to any other previous date of the report (set by the 'Difference Between Two Reports' parameter);
- The changes can be displayed not only as the absolute change in the contracts, but also as their percentages (set by the 'Type Values' parameter).
Below are the indicator parameters and their descriptions:
- Source of Report - TFF report type. There are two types of report: 'Futures Only' and 'Futures And Options';
- Group of Traders - Absolute group of TFF report participants.
- Difference Between Two Reports- The default value of 1 means that it will calculate the difference between the current and the value one week ago. The value of 2 means the difference between the current value and the value two weeks ago, etc.
- Type Values - The 'Absolute Values' means the display of the absolute changes in the number of contracts. The 'Percent Values' displays this change as a percentage of the previous value.
More details on the description of the indicator settings can be found in the blog "MetaCOT 2: Settings and Possibility".

The TFF report, the dynamics of changes in the absolute positions of the dealers, the Russian ruble
MetaCOT 2 TFF Netto Position
This indicator analyzes the Traders in Financial Futures (TFF) reports and is analogous to the classic Netto Position indicator, calculated for the COT reports.
TFF Netto Position is the indicator of net positions of market participants. It displays the difference between the long and short positions of one of traders groups, as well as the total open interest of the entire market. The indicator allows to analyze the dynamics of supply and demand in the major financial markets. The uptrends must be confirmed by increasing demand for the goods, while the decline in prices must be confirmed by a decline in demand. The discrepancies in these figures give an important signal about the potential market reversal.
Find out more details on the calculation method of this indicator in the book by Larry Williams: Trade Stocks and Commodities with the Insiders: Secrets of the COT Report".
Below are the main indicator parameters and their description:
- Source of Report - TFF report type. There are two types of report: Futures Only and Futures And Options;
- Group of Traders - group of TFF report participants.
This indicator is designed for analyzing financial markets (currencies, indices, bonds). Use the D-COT series indicators for analyzing the commodity markets (metals, oil and gas, food, raw materials), particularly the D-COT Netto Position.

The TFF report, chart of net positions of participants
MetaCOT 2 TFF Netto Changes
MetaCOT 2 Netto Changes in Commitments shows the changes in the net positions of market participants. The information on the market participants and the number of contracts held by them is obtained from the COT reports, published by the CFTC (U.S. Commodity Futures Trading Commission). The indicator data is similar to the values given in the "Changes in Commitments" section of the COT report, with the only difference that they are calculated for the net position and not the absolute position of the traders. In addition, the presented indicator has additional features:
- The changes in the number of contracts can be viewed not only compared to the previous week's publication, but also to any other previous date of the report (set by the 'Difference Between Two Reports' parameter);
- The changes can be displayed not only as the absolute change in the contracts, but also as their percentages (set by the 'Type Values' parameter).
Below are the indicator parameters and their descriptions:
- Source of Report - TFF report type. There are two types of report: 'Futures Only' and 'Futures And Options';
- Netto Group of Traders - Net group of TFF report participants.
- Difference Between Two Reports- The default value of 1 means that it will calculate the difference between the current and the value one week ago. The value of 2 means the difference between the current value and the value two weeks ago, etc.
- Type Values - The 'Absolute Values' means the display of the absolute changes in the number of contracts. The 'Percent Values' displays this change as a percentage of the previous value.
More details on the description of the indicator settings can be found in the blog "MetaCOT 2: Settings and Possibility".

The TFF report, the dynamics of changes in the net positions of the participants
MetaCOT 2 TFF Index
MetaCOT 2 is a set of indicators and specialized utilities, that allows to analyze the CFTC (U.S. Commodity futures trading commission) reports right in the MetaTrader terminal. This indicator analyzes the Traders in Financial Futures (TFF) reports and is analogous to the classic COT Index indicator, calculated for the COT reports.
TFF Index is the most popular, efficient and simple indicator for determining the extreme overbought and oversold points of the market. It is calculated based on the data on the net positions of traders from the TFF (Traders in Financial Futures) report according to the formula of the Stochastic oscillator. The values of the indicator from 0% to 20% and from 80% to 100% point at the moments of the extreme overbought and oversold state market, signaling the probable reversal of the price after reaching these levels.
Find out more details on the calculation method of this indicator in the book by Larry Williams: Trade Stocks and Commodities with the Insiders: Secrets of the COT Report".
Below are the main indicator parameters and their description:
- Source of Report - TFF report type. There are two types of report: Futures Only and Futures And Options;
- Group of Traders - group of TFF report participants;
- Period of COT Index - period of COT Index calculation. Recommended values: 26, 52 and 156 weeks;
More details on the description of the indicator settings can be found in the blog "MetaCOT 2: Settings and Possibility".
This indicator is designed for analyzing financial markets (currencies, indices, bonds). Use the D-COT series indicators for analyzing the commodity markets (metals, oil and gas, food, raw materials), particularly the D-COT Index.

Chart of TFF index (52 weekly, British pound)
MetaCOT 2 TFF Williams Commercial Index (Willco)
MetaCOT 2 is a set of indicators and specialized utilities, that allows to analyze the CFTC (U.S. Commodity futures trading commission) reports right in the MetaTrader terminal. This indicator analyzes the Traders in Financial Futures (TFF) reports and is analogous to the classic Willco indicator, calculated for the COT reports.
Williams Commercial Index (Willco) developed by Larry Williams is the most advanced version of the standard TFF Index. Unlike the latter, Willco compares extreme values of participant groups to cumulative open interest. Thus, Willco is a standard TFF Index weighted relative to the entire market. Like the latter, it is an oscillator and changes its value from zero to one hundred percent. The values of the indicator from 0% to 20% and from 80% to 100% point at the moments of the extreme overbought and oversold state market, signaling the potential reversal of the price after reaching these levels.
Find out more details on the calculation method of this indicator in the book by Larry Williams: Trade Stocks and Commodities with the Insiders: Secrets of the COT Report".
Below are the main indicator parameters and their description:
- Source of Report - TFF report type. There are two types of report: Futures Only and Futures And Options;
- Group of Traders - group of TFF report participants;
- Period of Willco Index - period of Willco Index calculation. Recommended values: 26, 52 and 156 weeks;
More details on the description of the indicator settings can be found in the blog "MetaCOT 2: Settings and Possibility".
This indicator is designed for analyzing financial markets (currencies, indices, bonds). Use the D-COT series indicators for analyzing the commodity markets (metals, oil and gas, food, raw materials), particularly the Williams Commercial Index D-COT.

Chart of TFF Willco (52 weekly, Russian ruble)
MetaCOT 2 TFF Movement Index
MetaCOT 2 is a set of indicators and specialized utilities, that allows to analyze the CFTC (U.S. Commodity futures trading commission) reports right in the MetaTrader terminal. This indicator analyzes the Traders in Financial Futures (TFF) reports and is analogous to the classic Movement Index, calculated for the COT reports.
Movement Index was first proposed by Steve Breeze and described in his book "The Commitments of Traders Bible: How To Profit from Insider Market Intelligence". It quickly gained popularity among the traders who analyze the CFTC reports, and became a classic and a unique tool in many aspects, which can be used for finding rapid changes, leading to an imbalance of positions between the market participants. The indicator is best suited to swing trading.
The indicator displays the change in the relative position of the participants as a histogram, expressed as a percentage. It ranges from -100% to + 100% and is calculated based on the data of the TFF Index or Willco Index indicator. The reverse signals appear when the absolute values of the indicator exceed the threshold, set to 40% by default.
While other indicators of the MetaCOT series are trend indicators, the Movement Index is a momentum indicator, i.e. it displays the rapid change in the positions of the market participants. Thus, the indicator becomes indispensable for analysis in conjunction with other indicators of the MetaCOT series. In addition, the Movement Index is not available on other programs which provide access to the CFTC reports.
Find out more details on the calculation method of this indicator in the article: Meta COT Project - New Horizons for CFTC Report Analysis in MetaTrader 4.
Below are the main indicator parameters and their description:
- Source of Report - TFF report type. There are two types of report: Futures Only and Futures And Options;
- Group of Traders - group of TFF report participants;
- Period - period to calculate the COT or Willco index. Recommended values: 26, 52 and 156 weeks;
- Movement Period - Period between two points of the index. The default is 6 weeks;
- Movement Type - Type of index calculation. The indicator can be calculated based on the classic TFF index, as well as the Willco;
- Critical Value - Critical value, when exceeded, the indicator generates alerts about the probable change in the trend.
More details on the description of the indicator settings can be found in the blog "MetaCOT 2: Settings and Possibility".
This indicator is designed for analyzing commodity markets (metals, oil and gas, food, raw materials). Use the TFF series indicators for analyzing the financial markets (currencies, indices, bonds), particularly the Movement Index D-COT.

Chart of TFF Movement Index (52 weekly, British pound)
Analysis of 'Largest Traders' section in COT reports
MetaCOT 2 L-COT Absolute Position
The indicator shows the positions of major market participants relative to the total number of open positions (open interest). In the COT report, the major participants are as follows:
- By greatest absolute position (By Gross Position). It is divided into two subgroups:
- The absolute positions of the four largest traders (4 or Less Traders);
- The absolute positions of the eight largest traders (8 or Less Traders);
- By the maximum net positions (By Net Position). In turn, it is also divided into two subgroups:
- The net position of the four largest traders (4 or Less Traders);
- The net positions of the eight largest traders (8 or Less Traders);
Therefore, the available 4 groups for analysis: 4, 8 largest traders to the absolute positions and the 4 and 8 largest traders to net positions. Data for this indicator directly available in the COT report:
The following are the key parameters and their meaning:
- Source of Report - L-COT report type. There are two types of report: Futures Only and Futures And Options;
- Group of Traders - Group of L-COT report participants;
More details on the description of the indicator settings can be found in the blog "MetaCOT 2: Settings and Possibility".

The COT report: chart of largest participants
MetaCOT 2 L-COT Absolute Changes
MetaCOT 2 L-COT Absolute Changes shows the changes in the number of contracts held by the largest market participants.
In addition, the presented indicator has additional features:
- The changes in the number of contracts can be viewed not only compared to the previous week's publication, but also to any other previous date of the report (set by the 'Difference Between Two Reports' parameter);
- The changes can be displayed not only as the absolute change in the contracts, but also as their percentages (set by the 'Type Values' parameter).
Below are the indicator parameters and their descriptions:
- Source of Report - COT report type. There are two types of report: Futures Only and Futures And Options;
- Group of Traders - Group of largest report participants. Includes the groups listed above;
- Difference Between Two Reports - The default value of 1 means that it will calculate the difference between the current and the value one week ago. The value of 2 means the difference between the current value and the value two weeks ago, etc.
- Type Values - The 'Absolute Values' means the display of the absolute changes in the number of contracts. The 'Percent Values' displays this change as a percentage of the previous value.
More details on the description of the indicator settings can be found in the blog "MetaCOT 2: Settings and Possibility".

The COT report: dynamic of changes positions of largest participants
MetaCOT 2 L-COT Netto Position
The indicator of the net positions of the market largest participants displays the difference between the long and short positions of one of the three trader groupsBelow is a complete list of displayed groups:
- The absolute netto positions of the four largest traders (4 or Less Traders);
- The absolute netto positions of the eight largest traders (8 or Less Traders);
- The netto net position of the four largest traders (4 or Less Traders);
- The netto net positions of the eight largest traders (8 or Less Traders);
Often the extreme values of the net position of one of the largest group members are the harbingers of the global market reversal. Below are the indicator parameters and their descriptions:
- Source of Report - COT report type. There are two types of report: Futures Only and Futures And Options;
- Group of Traders - Group of largest report participants. Includes the groups listed above;
More details on the description of the indicator settings can be found in the blog "MetaCOT 2: Settings and Possibility".

The COT report: chart of netto position of largest participants
MetaCOT 2 L-COT Netto Changes
MetaCOT 2 L-COT Netto Changes shows the changes in net positions of large market participants. This indicator has additional features:
- The changes in the number of contracts can be viewed not only compared to the previous week's publication, but also to any other previous date of the report (set by the 'Difference Between Two Reports' parameter);
- The changes can be displayed not only as the absolute change in the contracts, but also as their percentages (set by the 'Type Values' parameter).
Below are the indicator parameters and their descriptions:
- Source of Report - COT report type. There are two types of report: Futures Only and Futures And Options;
- Netto Group of Traders - Group of largest report participants. Includes the groups listed above;
- Difference Between Two Reports - The default value of 1 means that it will calculate the difference between the current and the value one week ago. The value of 2 means the difference between the current value and the value two weeks ago, etc.
- Type Values - The 'Absolute Values' means the display of the absolute changes in the number of contracts. The 'Percent Values' displays this change as a percentage of the previous value.
More details on the description of the indicator settings can be found in the blog "MetaCOT 2: Settings and Possibility".

The COT report: dynamic of changes netto position of largest participants
MetaCOT 2 L-COT Index
L-COT index is the classic COT Index calculated on data from major market participants. Because these data are relative, and show the percentage of contracts held by major participants relative to the total open interest, L-COT Index corresponds exactly to the indicator L-COT Willco. Therefore, L-COT Index does not exist as a separate indicator.
MetaCOT 2 L-COT Williams Commercial Index (Willco)
Williams Commercial Index (Willco) developed by Larry Williams is the most advanced version of the standard COT Index. Unlike the latter, Willco compares extreme values of participant groups to cumulative open interest. Thus, Willco is a standard L-COT Index weighted relative to the entire market. Like the latter, it is an oscillator and changes its value from zero to one hundred percent. The values of the indicator from 0% to 20% and from 80% to 100% point at the moments of the extreme overbought and oversold state market, signaling the frequent reversal of the price after reaching these levels. The data on net positions of traders is used as the basis of the calculation (see the MetaCOT 2 Netto Positions indicator).
Find out more details on the usage methods of this indicator in the book by Larry Williams: Trade Stocks and Commodities with the Insiders: Secrets of the COT Report", and also in the article Meta COT Project - New Horizons for CFTC Report Analysis in MetaTrader 4.
Below are the indicator parameters and their description:
- Source of Report - COT report type. There are two types of report: 'Futures Only' and 'Futures And Options';
- Group of Traders - Group of largest participants. Includes the groups listed above;
- Period of COT Index - period of COT Index calculation. Recommended values: 26, 52 and 156 weeks;
More details on the description of the indicator settings can be found in the blog "MetaCOT 2: Settings and Possibility".

Chart of Willco on largest participants (52 weekly, Silver)
MetaCOT 2 L-COT Movement Index
Movement Index was first proposed by Steve Breeze and described in his book "The Commitments of Traders Bible: How To Profit from Insider Market Intelligence". It quickly gained popularity among the traders who analyze the CFTC reports, and became a classic and a unique tool in many aspects, which can be used for finding rapid changes, leading to an imbalance of positions between the market participants.
The indicator displays the change in the relative position of the participants as a histogram, expressed as a percentage. It ranges from -100% to + 100% and is calculated based on the data of the L-COT Index or Willco Index indicator. The reverse signals appear when the absolute values of the indicator exceed the threshold, set to 40% by default.
While other indicators of the MetaCOT series are trend indicators, the Movement Index is a momentum indicator, i.e. it displays the rapid change in the positions of the market participants. Thus, the indicator becomes indispensable for analysis in conjunction with other indicators of the MetaCOT series. In addition, the Movement Index is not available on other programs which provide access to the CFTC reports. Thus, the MetaTrader platform and the MetaCOT set are the uncontested solution for the comprehensive analysis of the CFTC reports.
Find out more details on the usage methods of this indicator in the book by Larry Williams: Trade Stocks and Commodities with the Insiders: Secrets of the COT Report", and also in the article Meta COT Project - New Horizons for CFTC Report Analysis in MetaTrader 4.
Below are the main indicator parameters and their description:
- Source of Report - COT report type. There are two types of report: 'Futures Only' and 'Futures And Options';
- Group of Traders - Group of largest participants. Includes the groups listed above;
- Calculation On Data - Allows to select one of two indicators as the data for calculation: COT Index (classic option) or Willco Index (advanced option);
- Period of COT Index - Period of COT Index calculation, the indicator used for the calculation of the Movement Index. Recommended values: 26, 52 and 156 weeks;
- Movement Period - the difference between the current COT Index value and the value N periods back.
More details on the description of the indicator settings can be found in the blog "MetaCOT 2: Settings and Possibility".

Chart of Movement Index on largest participants (52 weekly, Silver)
Analysis of 'Commodity Index Trader Supplement' (CIT) reports
Report Commodity Index Trader Supplement is an expanded version of the classic COT report produced for some of the commodity markets. It is formed for the following markets:
- Wheat;
- Cacoa;
- Coffee;
- Cotton;
- Feeder cattle;
- Live cattle;
- Lean hogs;
- Sugar;
- Wheat;
- Soy (bean, meal, oil);
Besides the main groups of the COT report, CIT report includes information about long and short positions of the so-called index traders (CIT and CIT Long All Short All). Otherwise he repeats the COT report. This type of report is only available for futures and options.
MetaCOT 2 CIT Absolute Position
The absolute position indicator shows the dynamics of the open positions or the number of traders of each group of participants in the CIT report. It includes the following groups:
- Cumulative Open Interest of all market participants (Open Interest);
- Long position or the number of non-commercial traders (Non-Commercial Long);
- Short position or the number of non-commercial traders (Non-Commercial Short);
- Position of non-commercial traders or their number, that is covered (Non-Commercial Spread);
- Long position or the number of operators (Operators Long);
- Short position or the number of operators (Operators Short);
- Long position of non-reportable or small traders (Nonreportable Long);
- Short position of non-reportable or small traders (Nonreportable Short).
- Long position of index traders (CIT Long All);
- Short position of index traders (CIT Short All).
The indicator has one main parameter:
- Group of Traders - group participants report CIT. Includes groups listed above;
More details on the description of the indicator settings can be found in the blog "MetaCOT 2: Settings and Possibility".

Chart of CIT report: the positions of index traders
MetaCOT 2 CIT Absolute Changes
MetaCOT 2 Absolute Changes in Commitments shows the changes in the number of contracts held by the market participants. The information on the market participants and the number of contracts held by them is obtained from the CIT reports, published by the CFTC (U.S. Commodity Futures Trading Commission).
- The changes in the number of contracts can be viewed not only compared to the previous week's publication, but also to any other previous date of the report (set by the 'Difference Between Two Reports' parameter);
- The changes can be displayed not only as the absolute change in the contracts, but also as their percentages (set by the 'Type Values' parameter).
Below are the indicator parameters and their descriptions:
- Group of Traders - Group of CIT report participants. Includes the open interest, long and short side of the non-commercial traders, operators and non-reportable traders;
- Difference Between Two Reports- The default value of 1 means that it will calculate the difference between the current and the value one week ago. The value of 2 means the difference between the current value and the value two weeks ago, etc.
- Type Values - The 'Absolute Values' means the display of the absolute changes in the number of contracts. The 'Percent Values' displays this change as a percentage of the previous value.
More details on the description of the indicator settings can be found in the blog "MetaCOT 2: Settings and Possibility".

Chart of CIT report: changes in the positions of index traders
MetaCOT 2 CIT Netto Position
The indicator of the net positions of the market participants displays the difference between the long and short positions of one of the three trader groups, and also the gross open interest of the entire market and the number of positions that are covered by non-commercial traders. The COT (Commitments of Traders) report of the CFTC commission serves as the data source for this indicator. Below is a complete list of displayed groups:
- Cumulative Open Interest of all market participants (Open Interest);
- Net position of non-commercial traders (Netto Non-Commercial);
- Position of non-commercial traders, that is covered (Non-Commercial Spread);
- Net position of operators or commercial traders (Netto Operators Long);
- Net position of non-reportable or small traders (Nonreportable Long);
- Net position of index traders (Netto CIT);
Often the extreme values of the net position of one of the group members are the harbingers of the global market reversal. This indicator shows these values, indicating the potential reversals in the future.
The indicator has one main parameter:
- Group of Traders - Group of COT report participants. Includes the groups listed above;
More details on the description of the indicator settings can be found in the blog "MetaCOT 2: Settings and Possibility".

Chart of CIT report: schedule of net position of index traders
MetaCOT 2 CIT Netto Changes
MetaCOT 2 Netto Changes in Commitments shows the changes in the net positions of market participants. The information on the market participants and the number of contracts held by them is obtained from the CIT reports, published by the CFTC (U.S. Commodity Futures Trading Commission). The indicator data is similar to the values given in the "Changes in Commitments" section of the CIT report, with the only difference that they are calculated for the net position and not the absolute position of the traders. In addition, the presented indicator has additional features:
- The changes in the number of contracts can be viewed not only compared to the previous week's publication, but also to any other previous date of the report (set by the 'Difference Between Two Reports' parameter);
- The changes can be displayed not only as the absolute change in the contracts, but also as their percentages (set by the 'Type Values' parameter).
Below are the indicator parameters and their descriptions:
- Netto Group of Traders - Net group of CIT report participants.
- Difference Between Two Reports- The default value of 1 means that it will calculate the difference between the current and the value one week ago. The value of 2 means the difference between the current value and the value two weeks ago, etc.
- Type Values - The 'Absolute Values' means the display of the absolute changes in the number of contracts. The 'Percent Values' displays this change as a percentage of the previous value.
More details on the description of the indicator settings can be found in the blog "MetaCOT 2: Settings and Possibility".

Chart of CIT report: changes in net positions of index traders
MetaCOT 2 CIT Index
CIT Index is analog COT Index. It is the most popular, efficient and the simplest indicator for determining the extreme overbought and oversold points of the market. It is calculated on the basis of data on the net trader positions taken from the CIT report by the Stochastic oscillator formula. The values of the indicator from 0% to 20% and from 80% to 100% point at the moments of the extreme overbought and oversold state market, signaling the frequent reversal of the price after reaching these levels. The calculation is based on net positions of commercial, non-commercial and non-reportable traders, as well as the open interest.
Find out more details on the usage methods of this indicator in the book by Larry Williams:Trade Stocks and Commodities with the Insiders: Secrets of the COT Report", and also in the articleMeta COT Project - New Horizons for CFTC Report Analysis in MetaTrader 4.
Below are the indicator parameters and their description:
- Group of Traders - Group of COT report participants. Includes the groups listed above;
- Period of COT Index - Period of COT Index calculation. Recommended values: 26, 52 and 156 weeks;
More details on the description of the indicator settings can be found in the blog "MetaCOT 2: Settings and Possibility".

Chart of CIT Index (52 weekly, Sugar)
MetaCOT 2 CIT Williams Commercial Index (Willco)
Williams Commercial Index (Willco) developed by Larry Williams is the most advanced version of the standard CIT Index. Unlike the latter, Willco compares extreme values of participant groups to cumulative open interest. Thus, Willco is a standard CIT Index weighted relative to the entire market. Like the latter, it is an oscillator and changes its value from zero to one hundred percent. The values of the indicator from 0% to 20% and from 80% to 100% point at the moments of the extreme overbought and oversold state market, signaling the frequent reversal of the price after reaching these levels. The data on net positions of traders is used as the basis of the calculation (see the MetaCOT 2 Netto Positionsindicator).
Find out more details on the usage methods of this indicator in the book by Larry Williams: Trade Stocks and Commodities with the Insiders: Secrets of the COT Report", and also in the article Meta COT Project - New Horizons for CFTC Report Analysis in MetaTrader 4.
Below are the indicator parameters and their description:
- Group of Traders - Group of CIT report participants. Includes the groups listed above;
- Period of COT Index - period of COT Index calculation. Recommended values: 26, 52 and 156 weeks;
More details on the description of the indicator settings can be found in the blog "MetaCOT 2: Settings and Possibility".

Chart of CIT Willco ( 52-weekly, Wheat)
MetaCOT 2 CIT Movement Index
Movement Index was first proposed by Steve Breeze and described in his book "The Commitments of Traders Bible: How To Profit from Insider Market Intelligence". It quickly gained popularity among the traders who analyze the CFTC reports, and became a classic and a unique tool in many aspects, which can be used for finding rapid changes, leading to an imbalance of positions between the market participants.
The indicator displays the change in the relative position of the participants as a histogram, expressed as a percentage. It ranges from -100% to + 100% and is calculated based on the data of the CIT Index or Willco Index indicator. The reverse signals appear when the absolute values of the indicator exceed the threshold, set to 40% by default.
While other indicators of the MetaCOT series are trend indicators, the Movement Index is a momentum indicator, i.e. it displays the rapid change in the positions of the market participants. Thus, the indicator becomes indispensable for analysis in conjunction with other indicators of the MetaCOT series. In addition, the Movement Index is not available on other programs which provide access to the CFTC reports. Thus, the MetaTrader platform and the MetaCOT set are the uncontested solution for the comprehensive analysis of the CFTC reports.
Find out more details on the usage methods of this indicator in the book by Larry Williams: Trade Stocks and Commodities with the Insiders: Secrets of the COT Report", and also in the article Meta COT Project - New Horizons for CFTC Report Analysis in MetaTrader 4.
Below are the main indicator parameters and their description:
- Group of Traders - Group of CIT report participants. Includes the groups listed above;
- Calculation On Data - Allows to select one of two indicators as the data for calculation: COT Index (classic option) or Willco Index (advanced option);
- Period of COT Index - Period of COT Index calculation, the indicator used for the calculation of the Movement Index. Recommended values: 25, 52 and 156 weeks;
- Movement Period - the difference between the current CIT Index value and the value N periods back.
More details on the description of the indicator settings can be found in the blog "MetaCOT 2: Settings and Possibility".

Chart of CIT Movement Index ( 52-weekly, Wheat)
Translated from Russian by MetaQuotes Ltd.
Original code: https://www.mql5.com/ru/code/16767
 Holt's double exponential smoothing trend
Holt's double exponential smoothing - the trend component (mt4 version).
Holt's double exponential smoothing (mt4 version)
Holt's double exponential smoothing with linear forecasting.
 Ichimoku Kinko Hyo System
An EA fully based on the Ichimoku Kinko Hyo system.
Custom Moving Average Indicator
Code based on MetaTrader 4 Moving Average indicator.