Join our fan page
- Views:
- 31755
- Rating:
- Published:
-
Need a robot or indicator based on this code? Order it on Freelance Go to Freelance
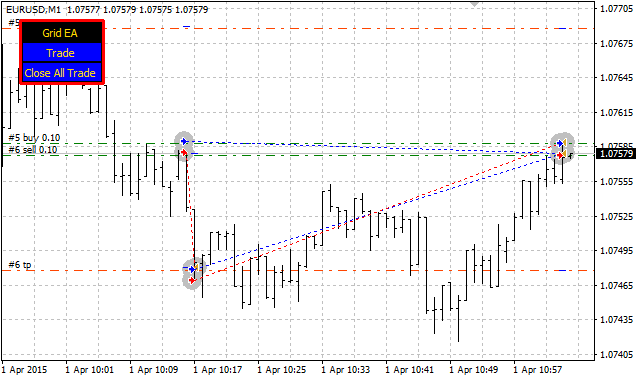
Let's say that a trader enters the market with a buy and sell active when a currency is at a level of, say, 100. The price then moves to 200. The buy will then be positive by 100 and the sell will be negative by 100. At this point we start breaking trading rules. We cash in our positive buy and the gain of 100 goes to our account. The sell is now carrying a loss of -100.
The grid system requires one to make sure that cash in on any movement in the market. To do this, one would again enter into a buy and a sell transaction. Now, for convenience, let's assume that the price moves back to level 100.
The second sell has now gone positive by 100 and the second buy is carrying a loss of -100. According to the rules, one would cash the sell in and another 100 will be added to your account. That brings the total cashed in at this point to 200.
Now the first sell that remained active has moved from level 200 where it was -100 to level 100 where it is now breaking even.
The 4 transactions added together now magically show a gain: 1st buy cashed in +100, 2nd sell cashed in +100, 1st sell now breaking even and the 2nd buy is -100. This gives an overall a gain of 100 in total. We can liquidate all the transactions and have some champagne.
There are many, many other market movements that turn this strange "buy and sell at the same time" activity into gains.

 Simple Max-Min Channel with Slope
Just a Donchian channel with slope. If xslope=0 it becomes the Donchian channel. It uses the moving average of Momentum.
 VR System Test
The script tests the computer in 45 performance tests. It is possible to compare the performance of VPS/VDS servers.
 Swapping
This indicator downloads history of symbols which have open charts. It will no longer be necessary to wait for an update when switching timeframes.
 The Expert Advisor based on 2 lines of the Moving Average
The Moving Average indicator values are used for trading.