Join our fan page
- Views:
- 3210
- Rating:
- Published:
- Updated:
-
Need a robot or indicator based on this code? Order it on Freelance Go to Freelance
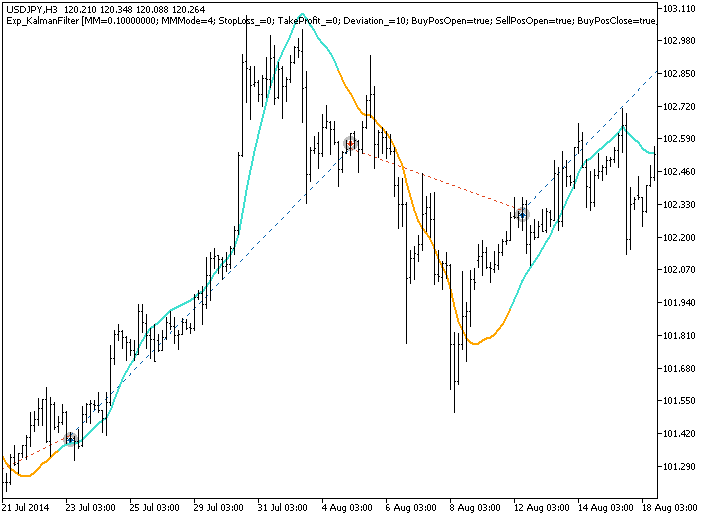
The Exp_KalmanFilter Expert Advisor is based on the KalmanFilter indicator color change. The signal is formed when a bar is closing if there is change in color of the indicator line.
This Expert Advisor requires the compiled indicator file KalmanFilter.ex5 in order to run. Place it to <terminal_data_folder>\MQL5\Indicators.
Note that the TradeAlgorithms.mqh library file allows using Expert Advisors with brokers who offer nonzero spread and the option of setting Stop Loss and Take Profit together with position opening. You can download more variants of the library at the following link: Trade Algorithms.
Default Expert Advisor's input parameters have been used during the tests shown below. Stop Loss and Take Profit have not been used during the tests.

Fig.1. Examples of deals on the chart
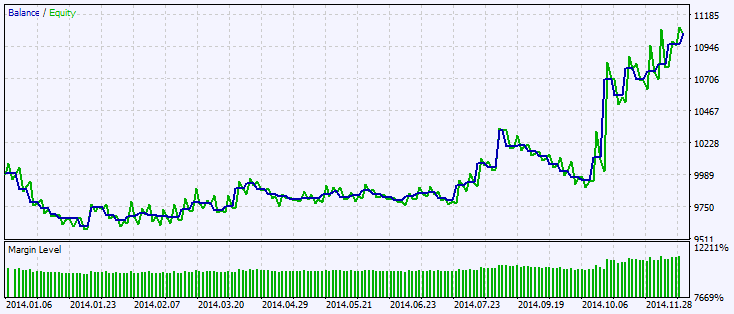
Testing results for 2014 at USDJPY H4:

Fig.2. Testing results chart
Translated from Russian by MetaQuotes Ltd.
Original code: https://www.mql5.com/ru/code/13895
 KalmanFilter_HTF
The KalmanFilter indicator with the timeframe selection option available in the input parameters.
 MultiColorZerolagJJRSXTrend_x10
The MultiColorZerolagJJRSXTrend_x10 indicator shows information on current trends using the ColorZerolagJJRSX indicator direction from ten different timeframes.
 Number of objects in the specified chart
An example of counting the number of objects in the chart window.
 KalmanFilterStDev
The KalmanFilter indicator with additional trend strength indication using colored dots based on the standard deviation algorithm.
