Join our fan page
- Views:
- 6251
- Rating:
- Published:
- Updated:
-
Need a robot or indicator based on this code? Order it on Freelance Go to Freelance
Real author:
klot
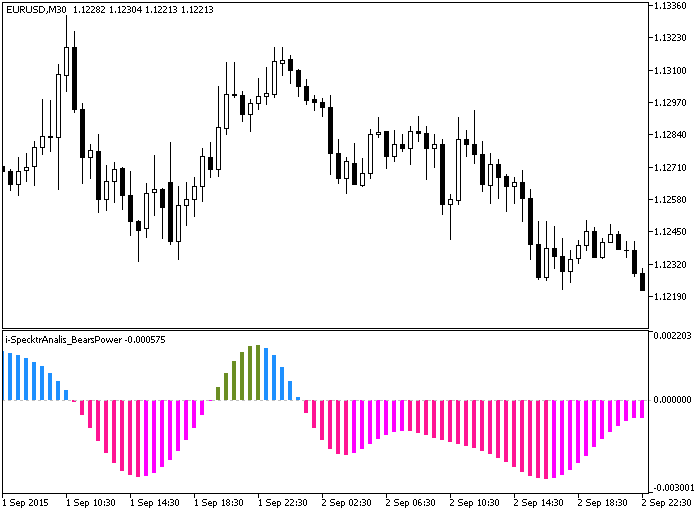
This indicator is an example of smoothing the Bears Power indicator timeseries by filtering high-order harmonics.
You can use this approach for smoothing the output of any indicator. The major advantage of this method is that it has practically zero latency.
Indicator input parameters:
input uint   ForcePeriod=13;
input  ENUM_MA_METHOD   MAType=MODE_EMA;
input ENUM_APPLIED_VOLUME VolumeType=VOLUME_TICK; // Volume
input uint N = 7;   // Series length
input uint SS = 20; // Smoothing coefficient
input int Shift=0;  // Horizontal indicator shift in bars
where:
- N — sets the series length (power of two);
- SS — smoothing coefficient in the resulting spectrum zeroes out frequencies exceeding the set value. SS cannot be greater than 2^N. If SS = 2^N, the Bears Power series is repeated.
This indicator requires the following library: https://www.mql5.com/ru/code/7000.

Fig.1. The i-SpectrAnalysis_BearsPower indicator
Translated from Russian by MetaQuotes Ltd.
Original code: https://www.mql5.com/ru/code/13766
 Force_3HTF
Three Force Index indicators from three different timeframes displayed on the same chart.
 i-SpectrAnalysis_WPR
This indicator is an example of smoothing the Larry Williams' Percent Range indicator timeseries by filtering high-order harmonics.
 i-SpectrAnalysis_BullsPower
This indicator is an example of smoothing the Bulls Power indicator timeseries by filtering high-order harmonics.
 Chaikin_3HTF
Three Chaikin Oscillator indicators from three different timeframes displayed on the same chart.