

The EUR/JPY started the week rallying, up from a price consolidation that ended last week. However, as we get ready for the 7/15 trading session, we should consider some technical signs that point to an imminent bearish attempt. Even if this theory is wrong, the reward to risk is favorable.
EUR/JPY 1H Chart 7/14:
Here are the reasons based on the 1H chart:
1) The prevailing trend in the short-term in bearish. Price has fallen at*the start of*July from 139.28 to a low of 137.50 last week.
2) There is a falling trendline coming down from July’s high of 139.28 connecting to a resistance pivot from last week at 138.76, and price is tagging that trendline.
3) Price touched the 200-hour SMA and is still trading below it.
Reward to Risk Consideration:
Reward: Since the trend is bearish in July, and before that as we
will see later, we can expect a potential downswing to challenge the
current low of 137.50, with no reason to believe it won’t break. But
this is a short-term trade idea in the 1H chart, and we should deal with
short-term expectations. Therefore, to be conservative let’s say 137.50 is the potential target for the short-term. An entry around 138.30 gives us a potential of 80 pips.
Risk: If price moves above 138.50, EUR/JPY will lose its bearish
structure formed in July. If the RSI pushes above 70, we are also seeing
some near-term bullish momentum that would suggest further
consolidation against July’s downswing. With this in mind, for an
intra-session trade, a stop might be placed above 138.50, ie. 138.65.
Entry from 138.30 would risk a potential loss of 35 pips. We might want
to give it some more elbow space because a break above 137.76 might be
needed to suggest the end of July’s bearish trend swing. If we put the
stop above that 138.76 pivot, let’s say 138.85. The risk would then be
55 pips.
The 80:55 reward to risk is not so attractive, but it does allow
more elbow space to stay clear of some near-term volatility risk. We
also know that even a break above 138.76 is not a guarantee our bearish
continuation idea is dead. A clear-out is possible, but at least we
would give that scenario some elbow space too.
The 80:35 reward to risk ratio is favorable as it is better than 2:1,
which means, if you are wrong half the time, you will have a profitable
trading performance with enough trades. However, given the trade less
elbow space means exposing the trade to more near-term volatility risk.
It is a trade-off as always between your assumed reward to risk, to
assumed probability of the trade working.
Without over thinking it, you can juggle between these two trade-offs.
Now let’s just take a look at the bigger picture to make sure we are not
in the middle of a bullish trend planning for a bearish trade.
EUR/JPY 4H Chart 7/14:
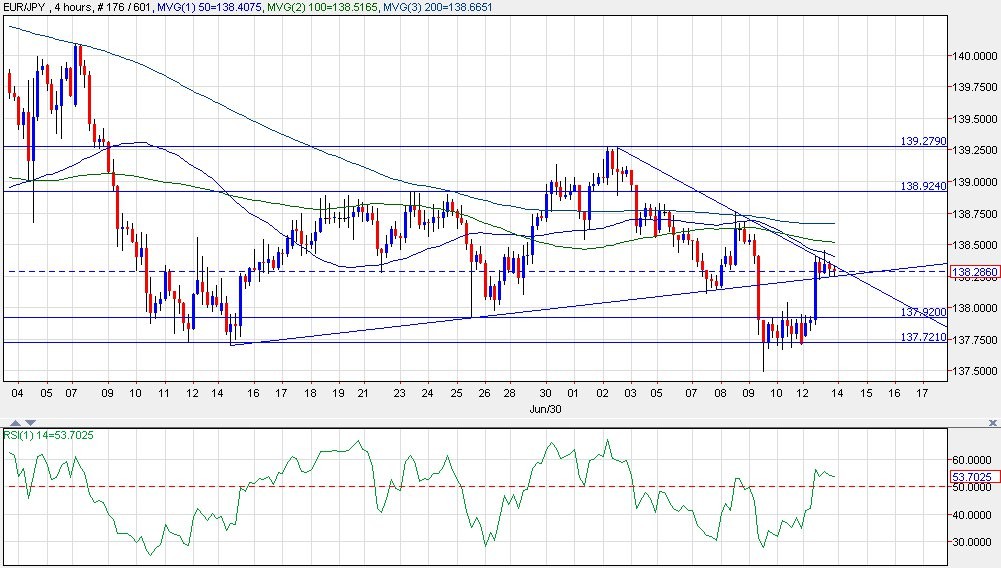
The 4H chart shows a market that has been consolidating during a downtrend. Here are some observations:
1) There was a failed rally attempt in June, where price popped
up to 139.28, but failed to establish a price bottom against the
prevailing bearish trend in the 4H chart. This can be considered a
clear-out because the prevailing*trend was bearish, and the price action
after the pop made a new low at 137.50.
2) The RSI has tagged 30 many times, but failed to pop up to 70, which suggests bearish but choppy momentum.
3) If we look at the market since the end of June, we are seeing bearish
development as the RSI dipped to 30 but has failed to climb back above
60.
4) And price has simply made lower highs and lower lows.
5) Price action also shows a break below a rising trendline, and now a
pullback that is still able to confirm the bearish outlook if it comes
back down below that line.
Final word: The 4H chart basically shows that this is also a
breakout/pullback trade idea. A break below 138.20 can kick start the
next bearish swing, so look out for that in the 7/15 session.


