VWAP and POC: two reference prices, and how to read them together

Most indicators answer the question "where is price going?". VWAP and the point of control answer a different one: "where has the volume been?". They do not predict anything, but they give you reference prices that come from a formula instead of from lines drawn by hand. This article explains what each one is, how to read them together, and the mistakes to avoid.
What VWAP is
VWAP is the volume-weighted average price. For each bar, take the typical price (high + low + close) / 3 and multiply it by the bar's volume. Add these values from the start of the period and divide by the total volume of the same period.
The result is the average price paid during that period, with busier bars counting more. If price is above the session VWAP, the average participant of the session is holding a position in profit on paper. If price is below it, the average participant is at a loss. Many traders use this as a simple way to describe who is in control of the session.
The period matters. A session VWAP resets every day. A weekly or monthly VWAP covers a longer period and moves more slowly. An anchored VWAP starts from a bar you choose, such as a major low or a news candle, and shows the average price since that event.
Deviation bands are drawn at one and two standard deviations around the VWAP, weighted by volume in the same way. They describe how far price has stretched from the average of the session.
What the point of control is
A volume profile spreads volume over price rows instead of time. The point of control (POC) is the row with the most volume. The value area is the range around it that holds a chosen share of the volume, usually 70 percent. Its top is the value area high (VAH) and its bottom is the value area low (VAL).
If the next session does not trade back to the previous POC, that POC stays "untested". Some traders keep these levels on the chart as references until price returns to them.
A note about volume in Forex and CFDs
Most Forex and CFD brokers do not provide real traded volume. MetaTrader 5 gives tick volume instead, which is the number of price changes in a bar. Tick volume tends to rise when activity rises, so it is a useful estimate, but it is an estimate. A profile built from M5 bars also has to spread each bar's volume over the rows it covers, which adds another approximation. Keep this in mind before you treat any level as exact.
Reading them together: a five-step routine

- Start with the longer lines. Is price above or below the weekly and monthly VWAP? This gives the background of the larger period.
- Look at the session VWAP. Is price pulling back towards it, or stretched out to the second band?
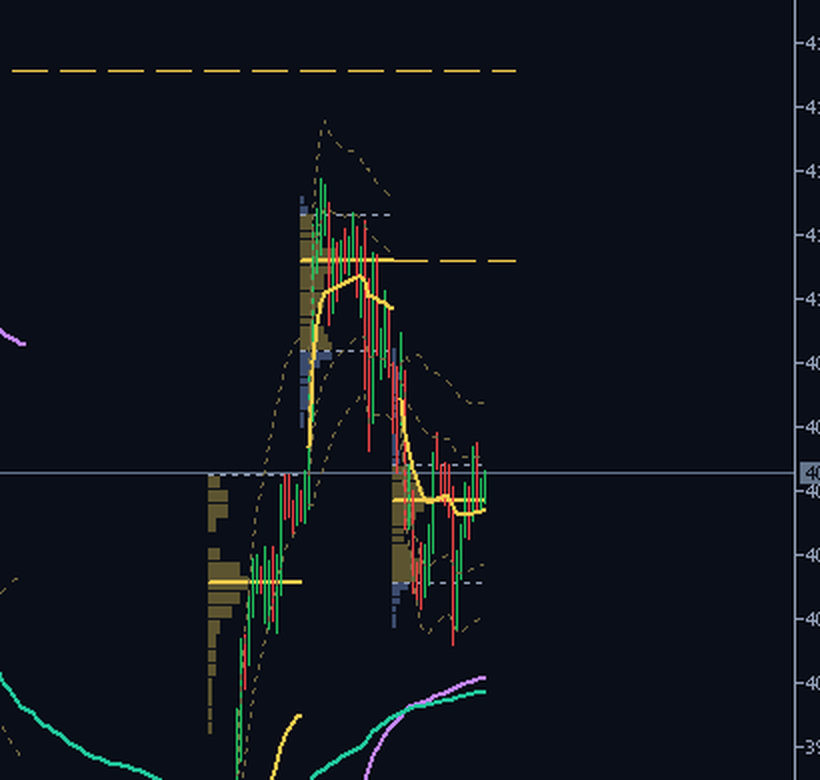
- Look for overlap. A session VWAP close to a POC, VAH, VAL or an untested POC marks a price where two independent calculations meet. That is an area worth watching, not a signal.
- Wait for a closed bar that confirms your own plan, for example a close back on the original side of the VWAP after a test. A touch alone tells you little.
- Place the stop beyond the level you used, and look at the next level as a reference for the target. If the distance to that level is smaller than your stop, skip the trade.
Common mistakes
- Treating the second band as a reversal signal. On trend days price can stay near the band for many bars. Waiting for a close back inside the band is a more careful reading.
- Trading every touch of the VWAP. When price crosses the line back and forth there is no clear side, and the line has little to say.
- Reading the open bar as final. The VWAP of the current bar and the profile of the current session keep changing until they are finished. This is normal and is not repainting, but it means the latest values are not settled.
- Forgetting the session start. If your broker's day does not start at the time you trade, shift the session start, or your daily VWAP will describe a different day from yours.
Summary
VWAP shows the average price paid in a period, and the POC shows where most of the volume traded. Neither tells you where price will go. Together they give you reference areas that are calculated, not guessed, and that is their value: a consistent way to decide where to pay attention and where to place a stop. Test any routine on a demo account before using it with real money.
The tool used for the pictures
The pictures were made with MelloVWAP, a free indicator in the Market that draws session, weekly, monthly and anchored VWAP together with a volume profile and untested POC levels. You can draw the same lines with any VWAP and profile tool; the routine above does not depend on a specific indicator.
Trading leveraged products involves a high risk of loss. This article is for education and is not investment advice.