
CCI Indicator Trading Strategy: How to Read Signals, Trade Divergence, and Confirm Momentum

CCI Indicator Trading Strategy: How to Read Signals, Trade Divergence, and Confirm Momentum
The Commodity Channel Index (CCI) is a popular technical indicator used by forex traders to identify momentum shifts, overbought and oversold conditions, and potential trading opportunities. Although originally developed for commodity markets, CCI is now widely used to trade forex, gold, indices, and other financial instruments.
Unlike oscillators that remain within a fixed range, CCI can move above +100 or below -100, helping traders evaluate strong price movements and changes in momentum.
However, CCI signals should not be treated as automatic buy or sell instructions. Understanding how to read CCI, recognize divergence, and combine momentum with price action can help traders make more informed decisions.
This guide explains how the CCI indicator works, how to interpret its signals, and how traders can use CCI divergence, trend pullbacks, and support and resistance to improve their trading decisions.
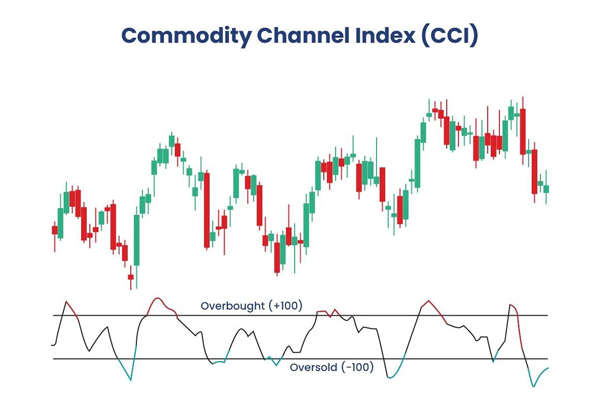
What Is the Commodity Channel Index (CCI)?
The Commodity Channel Index (CCI) is a momentum oscillator developed by Donald Lambert. It measures how far the current price deviates from its average price over a specific period.
When price moves significantly above its average, CCI rises. When price moves below its average, CCI falls. This allows traders to evaluate whether the market is experiencing unusually strong bullish or bearish momentum.
The default CCI setting is typically 14 periods, but traders can adjust it according to their strategy and timeframe.
CCI is commonly used to:
Identify overbought and oversold conditions.
Measure bullish and bearish momentum.
Detect potential trend reversals.
Confirm breakouts and trend continuation.
Identify pullback opportunities.
CCI can be applied to different markets and timeframes, making it useful for scalpers, intraday traders, and swing traders.
How to Read CCI Trading Signals
CCI provides several types of signals, but their reliability depends on market conditions and the surrounding price structure.
CCI Overbought and Oversold Levels
The +100 and -100 levels are commonly used to identify strong momentum and potentially extended price movements.
Above +100: Indicates strong bullish momentum.
Below -100: Indicates strong bearish momentum.
Returning from extreme levels: May suggest weakening momentum or a potential correction.
Many traders mistakenly sell as soon as CCI enters the overbought zone or buy immediately when it becomes oversold. However, during strong trends, CCI can remain in these zones for extended periods.
Instead of entering immediately, traders should wait for additional confirmation, such as a reversal pattern, support or resistance reaction, or a change in market structure.
CCI Zero-Line Crossover
The zero line separates positive and negative momentum.
When CCI crosses above zero, it suggests that momentum is shifting toward the bullish side. A move below zero indicates increasing bearish pressure.
Traders often use zero-line crossovers to confirm trend direction or identify momentum changes after a pullback.
However, in ranging markets, repeated crossovers can generate false signals. Combining CCI with trend analysis can help filter out unnecessary entries.
CCI Divergence: Bullish and Bearish Signals
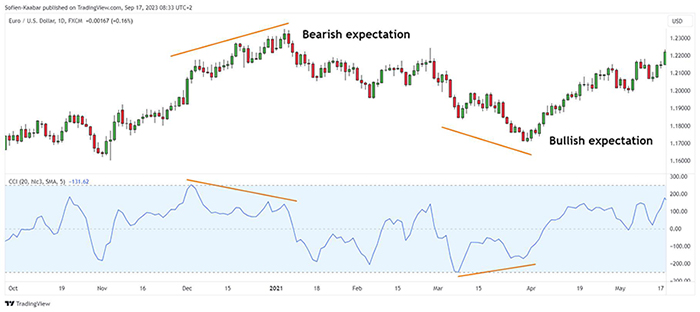
CCI divergence occurs when price movement and indicator momentum do not agree.
Bullish divergence: Price forms a lower low while CCI forms a higher low. This may indicate that selling pressure is weakening and a potential bullish reversal is developing.
Bearish divergence: Price forms a higher high while CCI forms a lower high. This may suggest that buying momentum is weakening and a potential bearish reversal could follow.
Divergence is particularly useful near important support and resistance zones. However, it does not guarantee that price will reverse.
Traders should wait for confirmation, such as a break of structure, trendline breakout, or strong reversal candle, before considering an entry.
Practical CCI Trading Strategies
Using CCI alongside price action and market structure can improve signal quality and help traders avoid random entries.
CCI Trend Pullback Strategy
Trend pullbacks provide opportunities to enter an established trend at a more favorable price.
In an uptrend, traders can wait for price to retrace toward support or a moving average while CCI moves toward zero or below it. When CCI turns upward and price confirms bullish momentum, a potential buy setup may develop.
In a downtrend, traders can look for a temporary bullish retracement followed by CCI turning downward and price showing bearish confirmation.
This approach focuses on trading with the dominant trend rather than fighting it.
CCI with Support and Resistance
Support and resistance levels help traders determine where CCI signals may have greater significance.
For example, if price reaches a resistance zone, CCI moves above +100, and momentum begins to weaken, traders can watch for bearish confirmation before considering a short position.
Similarly, bullish CCI signals near a strong support zone may provide a more meaningful setup than signals appearing in the middle of a range.
The key is to combine indicator readings with market location rather than trading CCI in isolation.
Choosing the Right CCI Period
The CCI period determines how sensitive the indicator is to price movements.
Shorter periods, such as 9 or 10, react faster and may suit scalpers looking for frequent momentum changes. However, they can also produce more noise and false signals.
Longer periods, such as 20 or 30, create smoother readings and may be more suitable for swing traders who want to focus on broader market movements.
The standard 14-period setting is a good starting point. Traders should test different settings on their preferred instruments and timeframes instead of assuming one configuration works everywhere.
Common Mistakes When Trading with CCI
Trading Every Overbought or Oversold Signal
CCI reaching an extreme level does not mean price must reverse. Strong trends can remain overbought or oversold for a long time, making countertrend trades risky.
Ignoring the Market Trend
Buying during a strong downtrend or selling during a strong uptrend simply because CCI provides a signal can lead to repeated losses. Higher-timeframe trend analysis helps traders avoid weak setups.
Entering Without Confirmation
CCI divergence and crossovers indicate potential opportunities, not guaranteed trades. Waiting for price action confirmation, market structure, and a clear entry trigger can help reduce impulsive decisions.
Conclusion
The Commodity Channel Index is a versatile tool for analyzing momentum, identifying potential reversals, and finding trend pullback opportunities. Overbought and oversold levels, zero-line crossovers, and divergence are among its most useful signals.
The best results come from combining CCI with price action, support and resistance, trend direction, and proper risk management. Rather than trading every signal, focus on setups where multiple technical factors align.

Recommended Trading Indicators
TW Multi Oscillator Divergence MT4
TW Multi Oscillator Divergence for MT4 helps traders identify bullish and bearish divergence using six popular oscillators: RSI, CCI, MACD, OBV, Stochastic, and Awesome Oscillator. It provides additional momentum analysis to help identify potential reversal areas and divergence confluence.
TW Multi Oscillator Divergence MT5
The MT5 version offers the same multi-oscillator divergence analysis, allowing traders to evaluate momentum differences between price and multiple indicators. It can help identify potential turning points and analyze divergence across different timeframes.
Both versions can complement price action, trend analysis, and other technical trading tools to support a more structured approach to market analysis.




