Price touches the lower Bollinger Band while remaining above the 200-period moving average. The picture resembles a familiar pullback, yet this week's candles are much larger than last week's. Does the same-looking signal represent a comparable trade? Measure the surrounding volatility before you compare outcomes. Band width and the stop distance relative to recent movement can make that review more informative.
Give the band touch a specific role
The SimpleRange method description uses a moving-average direction filter, a touch of the outer Bollinger Band and a qualifying closing candle. Its proposed stop follows the touch-to-signal structure, and the default target is based on the stop distance, with an adjustment available near opposing structure. The Navigator makes the proposed levels visible before an approved trade.
A band touch is an observation relative to recent prices. The bands change as their rolling inputs change. They can expand while price continues in one direction, and the moving average can react slowly after a rapid reversal. Keep the exact method trigger and its invalidation level in your plan while measuring the state in which that trigger occurred.
MetaTrader describes Bollinger Bands as a moving average with upper and lower lines separated from it by a chosen multiple of standard deviation. Standard deviation measures dispersion around the average. The platform's Bollinger Bands documentation provides the calculation. A two-standard-deviation setting by itself supplies no calibrated probability that the next trade will reverse or remain inside the bands.
Normalize the width before comparing periods
Define percentage band width for this review as upper band minus lower band, divided by the middle band, multiplied by 100. Use the same indicator settings and a completed signal bar for every observation. Saving all three band values lets you recompute the measurement later without relying on a screenshot's scale.
In a hypothetical EUR/USD snapshot, the middle band is 1.1000, the upper band is 1.1030 and the lower band is 1.0970. The full width is 0.0060, or 60 pips, because one EUR/USD pip is 0.0001 USD per EUR. Percentage width is 0.0060 divided by 1.1000 times 100, approximately 0.545%.
In a second hypothetical snapshot, the middle band is again 1.1000, but the outer bands are 1.1075 and 1.0925. Full width is 150 pips, or approximately 1.364%. The second width is 2.5 times the first. Both charts can show a lower-band touch above a longer moving average, while the dispersion of recent closes differs substantially.
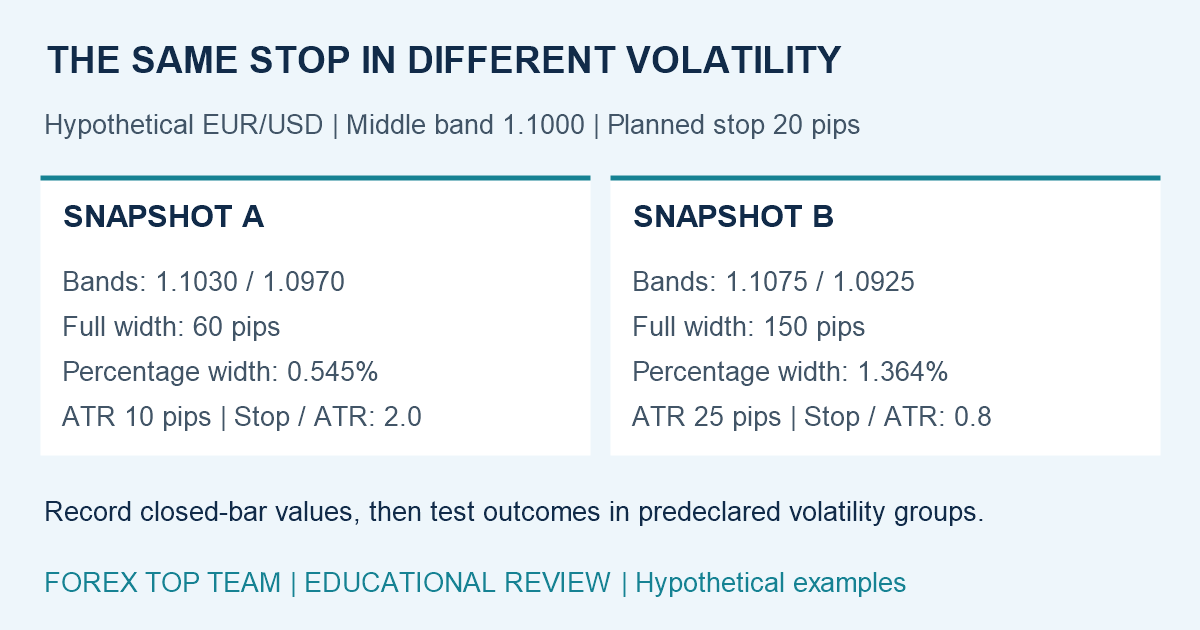 Hypothetical educational example. Values are illustrative.
Compare the stop with recent bar movement
Average True Range, or ATR, summarizes the size of recent price movement using true ranges, which incorporate the previous close. Its calculation is described in MetaTrader's ATR documentation. ATR and band width measure different aspects of the same price history. Keep the period, timeframe and observation timestamp with each reading.
Suppose the planned stop distance is 20 pips in both examples. If ATR is 10 pips in the first snapshot, the distance is 2.0 ATR. If ATR is 25 pips in the second, the same distance is 0.8 ATR. That comparison describes the stop's scale relative to recent ranges. Estimating how often either stop is reached still requires outcomes from a relevant sample.
Use the actual proposed stop distance and the ATR available when the signal closed. If a later bar expands ATR, avoid inserting that later value into the earlier decision record. Also distinguish a structural stop that moves with the setup from an optional fixed-distance stop. The two choices produce different groups even when their chart arrows look similar.
Build volatility groups without selecting the winners
Collect consecutive method signals and attach width, ATR, stop divided by ATR, spread, session and the net result in initial-risk units. Define 1R as the cash loss planned at entry. Mark whether an opposing level changed the target. A mixture of 2R targets and shorter adjusted targets can explain differences you might otherwise attribute to volatility.
Choose group boundaries using a prior training period and freeze them for the following review period. For example, you can define low, middle and high width groups from the earlier distribution. Report the sample size, mean net outcome, adverse excursion and equity path in each group. If one group contains only a few clustered news events, keep that limitation visible.
Changes in width can also matter. A high but stable reading describes a different path from a sudden expansion after a quiet period. Predefine how you measure expansion, such as the ratio of current closed-bar width to its value several closed bars earlier. Add that variable only when you can preserve enough observations to evaluate it without continually changing the rules.
Turn the measurement into a reviewable decision
Before approval, save the SimpleRange entry, stop, target, band values and chosen ATR reading. Record whether the setup sits within the market conditions your written plan allows. After the trade, verify fills and costs using the process in What a Range Trade Costs to Execute. Volatility measurements become useful when they explain differences in a consistently recorded sample.
The Forex Top Team Trading Toolkit includes SimpleRange Navigator and its semi-automatic Assist EA. Combine their displayed plan with an independent journal of volatility context. Keep any new approval threshold separate from the documented method so you can measure what that extra decision contributes on a fresh set of trades.