

What Helix Volume Profile Is
Helix Volume Profile is a chart indicator for MetaTrader. It reads one higher-timeframe session at a time: it fits a log-linear regression channel to the session's closes, bins the session's volume across that channel rather than across flat prices, and draws the result as a profile that leans with the session. The fullest bin is marked as a leaning Point of Control, and the session's high, low, midpoint and buying and selling volume are drawn beside it.
It does not place trades and it gives no buy or sell signal. The lines it draws are reference levels, and what they mark is not a forecast.
This manual covers installation and every setting. The companion trading guide covers how to read the picture.
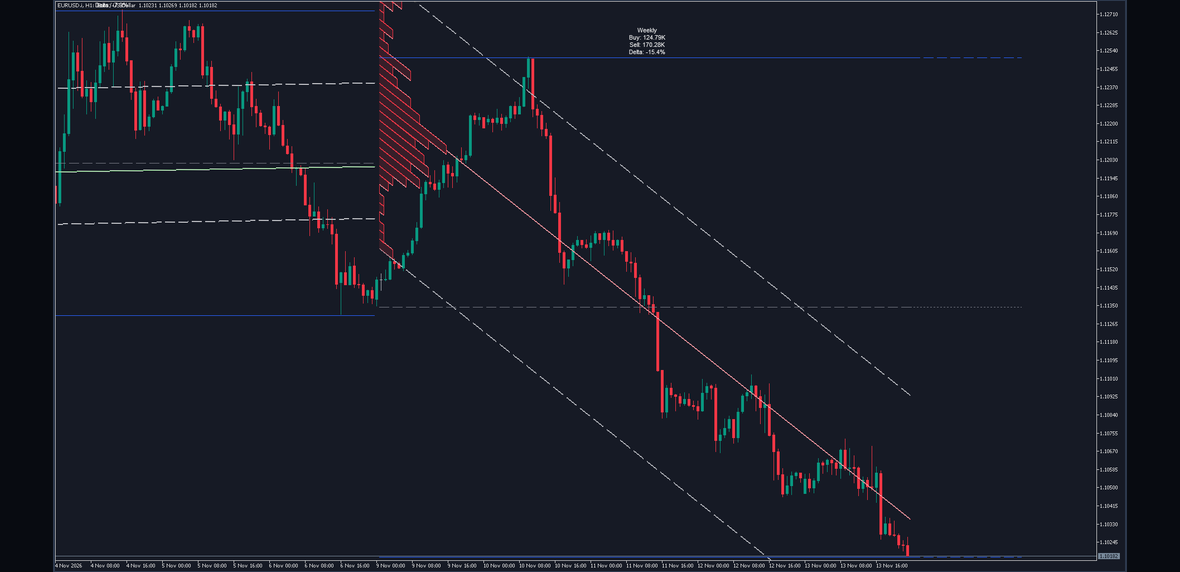
Helix Volume Profile on a EURUSD H1 chart at its shipped defaults. The session is a week.
Installation
Install it directly from the MQL5.com Market. After purchase the indicator installs automatically into the terminal the purchase is attached to; no manual file copying is required. A free demo is available on each product page for testing in the Strategy Tester first.
- Open the terminal and log in with the MQL5.com account the purchase is attached to.
- Open the Navigator panel (Ctrl+N).
- Expand Indicators, then Market. Helix Volume Profile is listed there.
- Drag it onto a chart, or double-click it.
- The settings dialog opens. Change what you want and press OK.
If it is not in the list, right-click Indicators in the Navigator and choose Refresh, or restart the terminal. If it is still missing, check that the terminal is logged in with the right MQL5.com account.
To change a setting later, right-click the chart, choose Indicators List, select Helix Volume Profile and press Edit. The keyboard shortcut for the list is Ctrl+I.
It attaches to the price chart, not to a separate window. It uses no DLL, makes no network request and writes no files.
What You See
The regression channel. Two dashed lines, the upper and lower edges, a number of standard deviations of the session's closes either side of a log-linear fit of those closes. The channel leans with the session.
The volume profile. A staircase of bins laid across the channel from the first bar of the session, each as wide as its share of the fullest bin. Each bin leans with the channel, so it is a parallelogram rather than a flat bar. Only bars whose close lies inside the channel are binned.
The Point of Control. A line through the middle of the fullest bin, from the start of the session to the current bar, parallel to the channel. It is drawn in the bullish colour when the channel leans up and the bearish colour when it leans down, and the profile takes the same colour.
The session high and low. Solid lines from the first bar of the session to the current bar, at Line Thickness.
The midpoint. A dashed line halfway between the session high and low.
The forward extensions. The high and low run on as dashed lines and the midpoint as a dotted line, past the last bar, for Extension Length bars. They follow the session in progress; completed sessions do not keep their own.
The label. Four lines above the session high, centred on the session's middle bar: the session in use, buying volume, selling volume, and the delta between them as a signed percentage. Buying volume is the volume of the session's bars that closed above their open, selling volume that of the bars that closed below it, and a bar that closed exactly where it opened counts to neither.
Completed sessions. Behind the current one, newest first, each with its own channel, profile, Point of Control, levels and label.
The extensions are drawn past the last bar by design. Use the terminal's chart shift control to leave room on the right if you want them clear of the candles.
When It Is Calculated
The session in progress is recalculated on every tick. On the forming bar the channel, the bins, the Point of Control, the session high and low, the extensions and the label all move as prices and volume arrive. There is no setting that freezes them, and nothing about the current session is fixed before it ends.
A completed session never changes again. When a session ends, its drawings are fixed on its closed bar and kept exactly as they were.
Volume is whatever your broker reports. On symbols where the feed carries no exchange volume, which is most forex symbols, that is tick volume: a count of price changes rather than of contracts. Two brokers will not report the same count for the same bar, so the label's numbers depend on the feed even when the shape of the profile is similar.
Inputs
Every setting, in the order the dialog shows it, with the default it ships with and the range it accepts. A separate check reads these tables back and compares every cell with the shipped source, so a value here cannot drift away from the build.
Higher Timeframe Settings
| Setting | Default | Allowed | What it does |
|---|---|---|---|
| Auto Higher Timeframe | true | true or false | Pick the session from the chart you are on. See How the Session Is Chosen. |
| Manual Higher Timeframe (e.g. 240, D, W, 2M) | D | any text | The session to use when Auto is off: minutes as a number, or D, W, 2M and so on. It is used only when Auto is off, so a value left here does no harm. |
Channel & Dimensions
| Setting | Default | Allowed | What it does |
|---|---|---|---|
| Channel Width (standard deviations) | 1.0 | any value | How many standard deviations of the session's closes each edge sits from the fit. At 0 the channel collapses onto its fitted line and nothing is binned. |
Visuals & Colors
| Setting | Default | Allowed | What it does |
|---|---|---|---|
| Line Thickness | 2 | any value | The thickness of the session high and low and of their forward extensions. |
| Show Midpoint Line | true | true or false | Draw the midpoint between the session high and low, and its extension. |
| Session High Colour | 41,98,255 (blue) | any colour | The session high and its extension. |
| Midpoint Colour | 120,123,134 (grey) | any colour | The midpoint and its extension. |
| Session Low Colour | 41,98,255 (blue) | any colour | The session low and its extension. |
| Bullish Profile Colour | 76,175,80 (green) | any colour | The profile and the Point of Control when the channel leans up. |
| Bearish Profile Colour | 242,54,69 (red) | any colour | The profile and the Point of Control when the channel leans down. |
| Channel Upper Colour | 120,123,134 (grey) | any colour | The upper edge of the channel. |
| Channel Upper Style | Dashed | Solid, Dashed or Dotted | The line style of the upper edge. |
| Channel Lower Colour | 120,123,134 (grey) | any colour | The lower edge of the channel. |
| Channel Lower Style | Dashed | Solid, Dashed or Dotted | The line style of the lower edge. |
Volume Profile & Statistics
| Setting | Default | Allowed | What it does |
|---|---|---|---|
| Show Statistics Label | true | true or false | Draw the four-line label above the session high. |
| Show Volume Profile | true | true or false | Bin the session's volume and draw the profile. With it off nothing is binned, so the Point of Control and both channel edges go too. |
| Bin Count (5-100) | 30 | 5 to 100 | How many bins the channel is cut into. A value outside the range is held at the nearest end of it. |
| Profile Max Width (bars) | 15 | any value | How many bars wide the fullest bin is drawn; the rest are drawn in proportion. At 0 the profile is a vertical line. |
| Show Point of Control | true | true or false | Draw the Point of Control line. The profile stays either way. |
History & Extension
| Setting | Default | Allowed | What it does |
|---|---|---|---|
| Extend Levels Forward | true | true or false | Run the session high, low and midpoint past the last bar. |
| Extension Length (bars) | 25 | any value | How many bars past the last bar the extensions run. |
| Max Completed Sessions (1-50) | 10 | 1 to 50 | How many finished sessions stay on the chart. A value outside the range is held at the nearest end of it. |
MetaTrader
| Setting | Default | Allowed | What it does |
|---|---|---|---|
| Bars To Compute (0 = every bar on the chart) | 0 | any value | How much chart history is worked through. 0 uses every bar on the chart. |
| Chart Object Budget (0 = measured default) | 0 | any value | MetaTrader 4 only. Caps how many chart objects the drawing may use. 0 uses a measured default. |
| Write Diagnostics To The Journal | false | true or false | Print diagnostic lines to the Experts tab. Off unless you are asked for it. |
How the Session Is Chosen
With Auto Higher Timeframe on, the session follows from the chart:
| Your chart | Session it groups into |
|---|---|
| 1 minute | 4 hours |
| 2 to 14 minutes | 12 hours |
| 15 to 59 minutes | 2 days |
| 1 hour to under 4 hours | 1 week |
| 4 hours to under a day | 1 month |
The first line of the label always names the session in use, so you never have to work it out.
One case to know about. On a daily chart, Auto resolves the session to a day as well. Each chart bar is then its own session, the regression has a single point, and the profile, the Point of Control and both channel edges do not appear. The session high, low, midpoint and the label still draw. On a daily chart, turn Auto Higher Timeframe off and type a session yourself, W or 2M for example.
Settings That Interact
Show Volume Profile does more than hide the profile. With it off, nothing is binned at all, so there is no fullest bin, and the Point of Control and both channel edges go with it. The session high, low, midpoint and the label carry on.
Channel Width at 0 collapses the channel onto its fitted line. The bins then have no height, nothing is binned, and the profile and the Point of Control disappear. That is a valid setting, not a fault.
The channel edges can vanish partway through a session. If the profile becomes empty mid-session, because no close of the session lies inside the channel, both edges are removed with it and return when the next session starts.
Line Thickness and dashed lines. MetaTrader 4 draws a dashed or dotted chart object only at a thickness of one pixel; above that it draws it solid. At the default Line Thickness of 2, the forward extensions of the session high and low therefore show solid on MetaTrader 4. Set it to 1 there if you want them dashed. MetaTrader 5 draws them dashed at any thickness. The channel edges and the midpoint are always one pixel and are unaffected.
Differences Between the Two Editions
Every number is the same on MetaTrader 4 and MetaTrader 5: the same bins, the same widths, the same Point of Control, the same channel, the same high, low, midpoint and label.
One thing is drawn differently. The MetaTrader 5 edition fills the profile with the leaning colour at a light transparency, by drawing a single image over the chart. MetaTrader 4 cannot draw a transparent image at all, so the MetaTrader 4 edition draws the profile as its true leaning outline, bin by bin, with no fill behind it. The geometry is identical; only the fill is absent.
Performance
On MetaTrader 5 everything is painted into one image above the candles, so there is no object count to run out of.
On MetaTrader 4 the drawing is made of chart objects. The terminal was measured holding 4,000 chart objects, created in 15 milliseconds and all moved in under one, so a scroll or a zoom at the default settings is not something you will notice. Chart Object Budget at 0 sets a limit from that measurement, far above what the defaults need. A very high Bin Count with a very high Max Completed Sessions can reach it; with Write Diagnostics To The Journal on, the Experts tab says so, and lowering either setting brings it back under.
The first load works through every bar on the chart, because which session a bar belongs to depends on where every earlier session began. Lower Bars To Compute to make it faster; sessions older than the bars it covers are not drawn. The terminal's own Max bars in chart setting, in Tools then Options then Charts, limits how much history the chart holds in the first place.
Troubleshooting
Nothing is drawn. The chart needs at least two bars of history. On a daily chart with Auto on, see How the Session Is Chosen.
The profile is missing but the high and low are there. Either Show Volume Profile is off, or Channel Width is 0, or no close of this session has landed inside the channel yet. All three have the same result by design.
The channel edges vanished partway through a session. The profile became empty and the edges went with it. They return when the next session starts.
Sessions are missing from the left of the chart. Raise Bars To Compute, or set it to 0. Check the terminal's Max bars in chart as well.
The extensions are off the right edge. They are drawn past the last bar. Increase the chart shift, or lower Extension Length.
The extensions are solid when they should be dashed. You are on MetaTrader 4 with Line Thickness above 1. See Settings That Interact.
The profile has no fill. You are on MetaTrader 4, which cannot draw a transparent fill. The outline is the same profile.
Frequently Asked Questions
Does it repaint? The session in progress is recalculated on every tick and moves until it ends; that is stated openly, not hidden. A completed session is fixed on its closed bar and never changes again.
Which symbols and timeframes does it work on? Any symbol the terminal charts, from M1 to monthly. On a daily chart, choose the session yourself.
Why does my profile differ from someone else's on the same pair? Different brokers report different tick volume and different history for the same bar. The shape is usually similar; the numbers on the label are not identical.
Why do the profile and the label not add up? The label counts every bar of the session. The profile counts only the bars whose close lies inside the channel.
Does it send alerts? No. It has no alerts, so there is nothing to set up.
Does it need an internet connection or a DLL? No. It uses no DLL, makes no network request and writes no files.
Support
Questions and problems go through the product's Comments (Discussion) tab on its page, so other users can see the answer too. Include your symbol, timeframe, terminal build and the settings you are using. If something looks wrong, switch on Write Diagnostics To The Journal, reproduce it, and paste the lines it prints in the Experts tab.
Version History
1.00 First release. MetaTrader 4 and MetaTrader 5 editions, built from one shared calculation.
Risk Disclaimer
Trading leveraged products carries a high level of risk and may not be suitable for all investors. Helix Volume Profile is an analysis tool, not financial advice. It gives no signals and places no orders, and nothing it draws is a recommendation to buy or sell. Test it on a demo account first, and never risk money you cannot afford to lose.


