
Helix Volume Profile: reading a leaning volume profile, session by session

Introduction
A classic volume profile asks one question: at which prices did the most trading happen? It answers by stacking every bar's volume into flat rows of price and drawing the result beside the candles.
That works well when a market spends its time going sideways. It works less well when the market is trending, because a trend keeps moving the prices themselves. A week that drifted down two hundred pips spreads its volume across two hundred pips of flat rows, and the shape you get says more about the size of the move than about where the business was done inside it.
Helix Volume Profile asks a slightly different question: inside the path the session actually took, where did the most trading happen? It fits a channel to the session, lets that channel lean with the trend, and measures the volume across the channel rather than across flat prices. The profile it draws leans with the session, and its Point of Control runs along the trend instead of sitting at one fixed price.
This post is about reading that picture. The companion manual covers installation and every setting one by one.
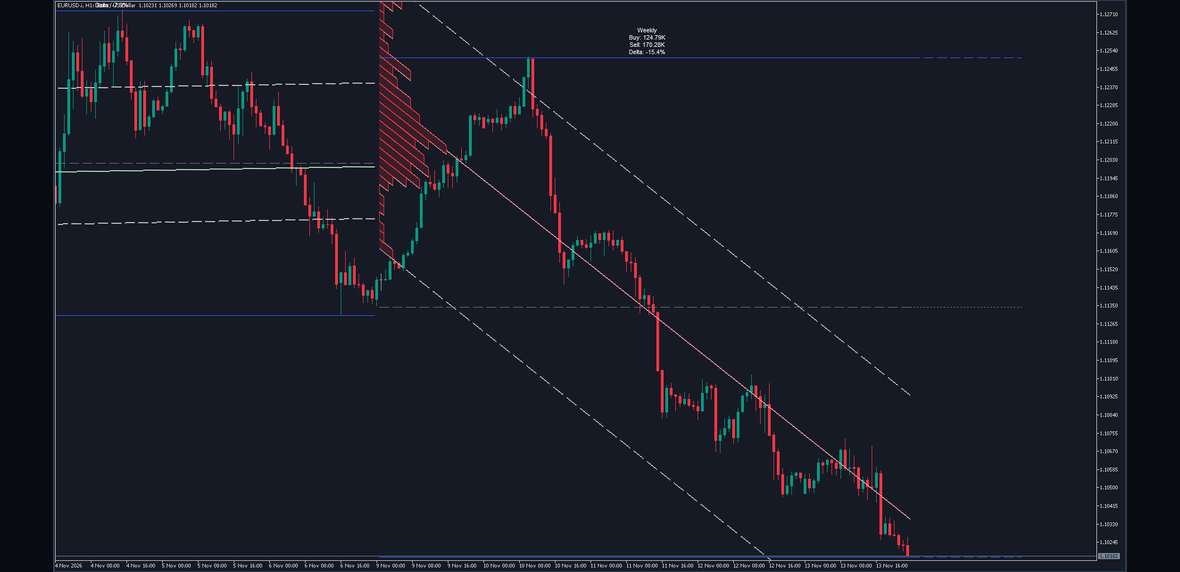
Helix Volume Profile on a EURUSD H1 chart at its shipped defaults. The session is a week.
What It Draws
Everything it draws belongs to one higher-timeframe session at a time, and there are six parts.
A regression channel: a line fitted to the session's closes, with an upper and a lower edge drawn a set number of standard deviations away from it. Both edges are dashed by default.
A volume profile across that channel: the session's volume, dropped into bins laid across the channel and drawn as a leaning staircase from the first bar of the session. The longer a bin, the more volume traded in that part of the channel.
The Point of Control: a line through the middle of the fullest bin, running from the start of the session to the current bar, parallel to the channel. It is green when the channel leans up and red when it leans down, and the profile takes the same colour.
The session high and low, as solid lines from the first bar of the session to the current bar, and the midpoint between them as a dashed line.
Forward extensions of the high, the low and the midpoint, drawn past the last bar so you can see where they stand against the price that is still to come.
A four-line label above the session high: the session in use, its buying volume, its selling volume, and the balance between the two as a signed percentage.
When a session ends, everything it drew stays on the chart as a record, and the next session starts drawing its own.
How It Is Built
The whole picture comes from four steps, and the indicator repeats them on every bar of the session.
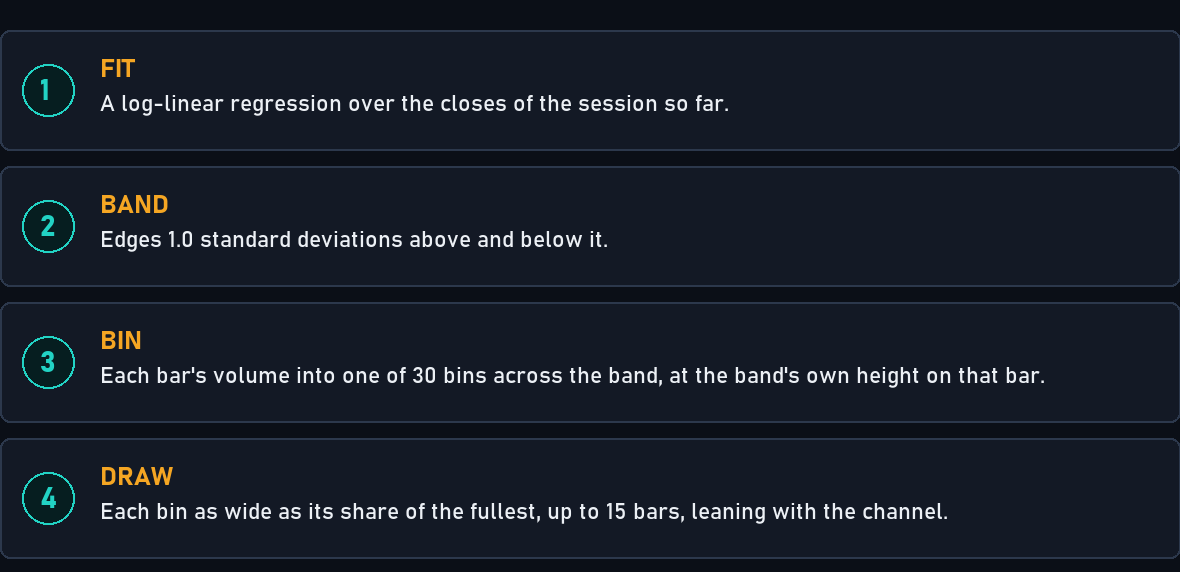
Illustration of the rule: fit the session's closes, draw a band around the fit, drop each bar's volume into the band, and draw each bin in proportion to the fullest one.
Fit. The closes of the session so far are fitted with a log-linear regression: a straight line through the logarithm of each close, which is the same as a constant percentage rate of change. The fit is refitted on every bar, so it changes as the session grows.
Band. The standard deviation of the session's closes, multiplied by Channel Width (1.0), is added above the fitted line and subtracted below it. Those are the channel's edges.
Bin. Every bar of the session is visited again. Its close is compared with the channel at that bar's own position, and if the close lies inside the channel, the bar's whole volume goes into one of Bin Count (30) equal slices of the channel's height.
Draw. The fullest bin is drawn Profile Max Width (15) bars wide and every other bin in proportion to it, rounded to whole bars. Each bin is sheared to follow the channel's slope, so it is a parallelogram, not a flat rectangle.
The bins are rebuilt from nothing on every bar. They have to be: the channel's edges move whenever the fit moves, and a bin measured against yesterday's channel would be measuring against a channel that no longer exists.
The Channel
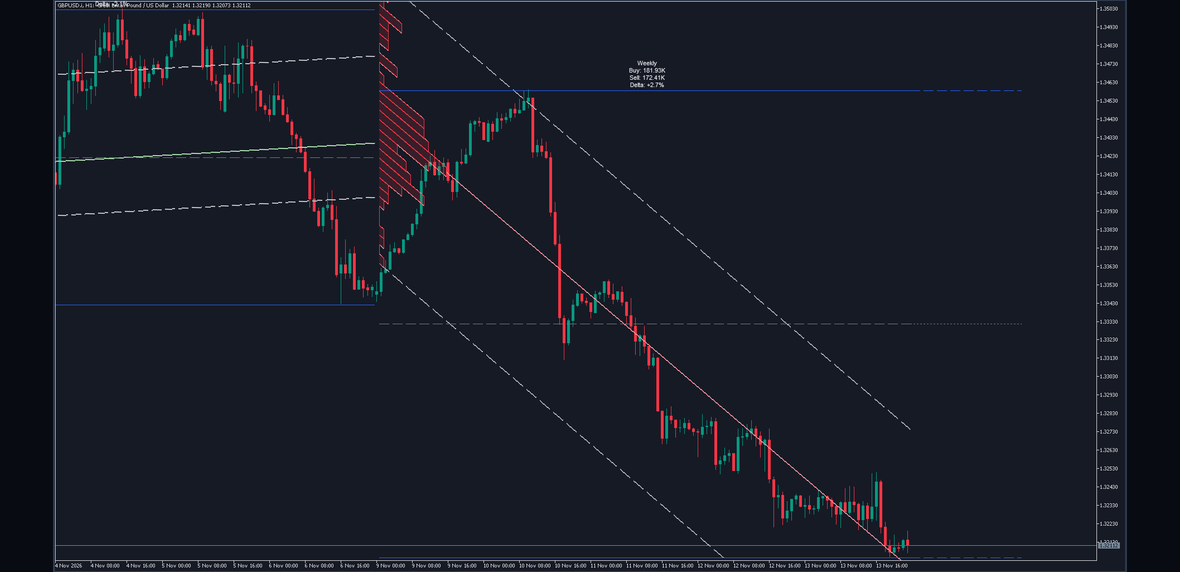
A real chart, GBPUSD H1: the dashed channel edges of a weekly session, leaning down with it.
The channel answers the first question worth asking of any session: which way has it been going, and how much has it wandered from that path?
The lean is the direction. A channel that slopes up describes a session whose closes have been rising at a fairly steady rate; one that slopes down, the opposite. A nearly flat channel describes a session without much direction at all.
The width is the spread. The edges sit a number of standard deviations of the session's closes from the fit, so a session whose closes covered a wide range gets a wide channel, and a quiet session gets a narrow one.
Two things are worth knowing about the edges. First, they are not support and resistance in any promised sense. They are a statistical description of where the session's closes have been, and nothing more. Second, the deviation is that of the closes themselves, not of their distance from the fitted line. On a session that trended steadily the closes spread a long way, so the band is wide compared with how closely they followed the line. On a session that went sideways the band is narrower, and more of the closes end up outside it. A close outside the channel matters for the profile, as the next section explains.
The Profile
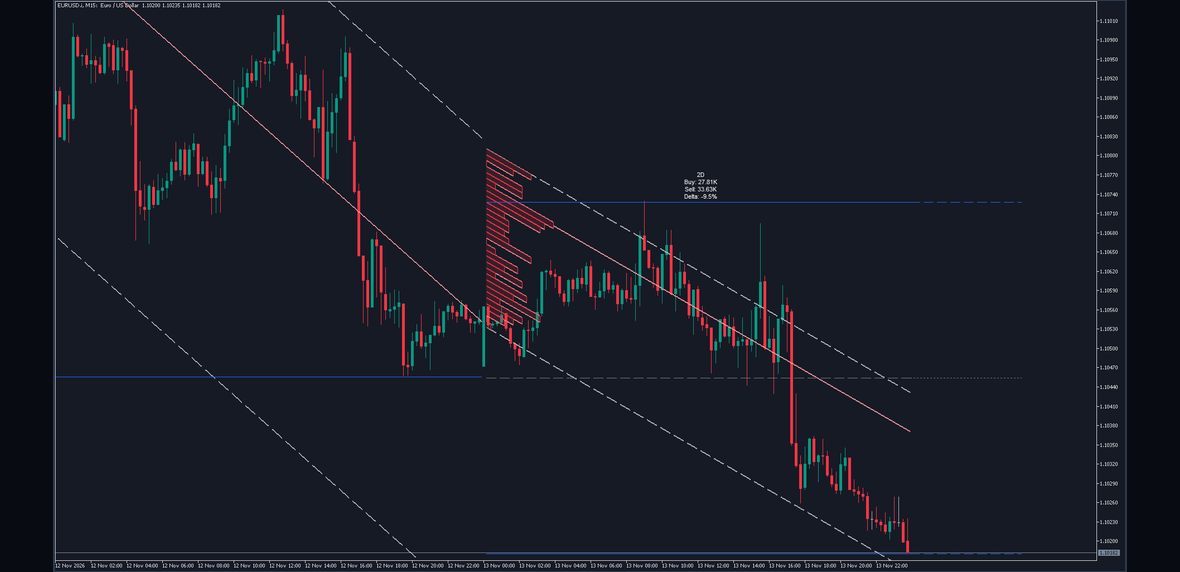
A real chart: the session's volume binned across the channel, drawn as a staircase that leans with it.
Here is the idea that makes this profile different. A bin is not a fixed price. It is a fixed position inside the channel: the bottom thirtieth of the channel, the next thirtieth up, and so on. Each bar's close is placed against the channel as it stood at that bar, so a bar near the top of the channel on Monday and a bar near the top of the channel on Thursday land in the same bin, even if the trend has carried the price a long way in between.
So the profile answers: when the session traded, where inside its own path did it trade? A bulge near the lower edge of a rising channel says most of the volume came in on the dips. A bulge near the upper edge of a falling channel says most of it came in on the rallies. A bulge in the middle says the session did most of its business close to its own trend line.
Only bars whose close lies inside the channel are binned. A bar that closed outside it adds nothing to the profile, although its volume still counts in the buying and selling totals on the label. That is why the profile and the label do not have to agree, and it is why Channel Width is the setting that changes the profile most: widen it and more of the session's bars are binned.
On MetaTrader 5 the profile is filled with the leaning colour at a light transparency and outlined. MetaTrader 4 cannot composite a transparent image, so the MetaTrader 4 edition draws the same leaning outline, bin by bin, with no fill behind it. Every number is the same on both.
The Point of Control
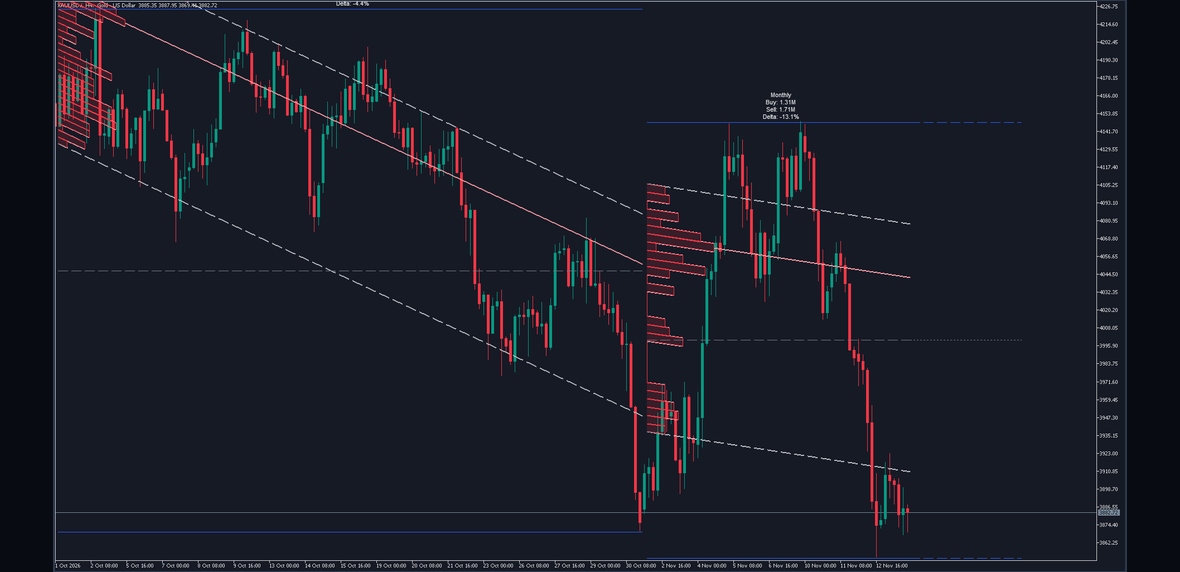
A real chart: the line through the fullest bin, parallel to the channel and coloured by its lean.
The Point of Control is the bin with the most volume, and the line through its middle. Where two bins hold exactly the same volume, the lower one wins.
Because the bins lean, so does the line. It starts at the first bar of the session and runs to the current bar, parallel to the channel, through the centre of the fullest bin. Read it as the path inside the trend along which the session has done the most business.
Its colour is the channel's direction, not a verdict. When the line ends at or above where it started, it takes the Bullish Profile Colour (green by default); when it ends below, the Bearish Profile Colour (red by default). The profile takes the same colour, so one glance tells you which way the session leans.
What traders generally do with it is treat it as a reference: price trading above the leaning Point of Control is trading above the session's busiest path, and price below it is trading below. Price returning to that path is common; price leaving it and staying away is how a session ends up with its busiest bin somewhere else. None of that is a rule. The line says where volume has already been heaviest, and what price does next is not in the measurement.
Buying and Selling Volume
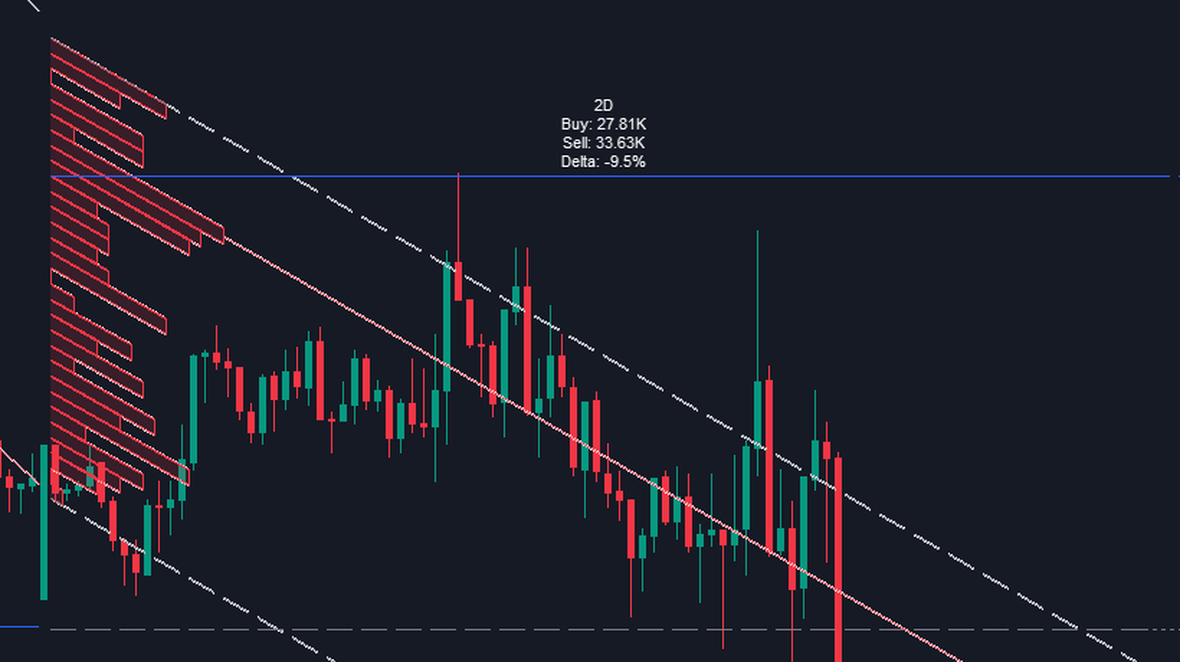
A real chart, EURUSD M15, enlarged: the four-line label of a 2 day session above its high.
The label sits above the session high, centred on the session's middle bar, and reads four lines.
The first line names the session in use: 4h, 12h, Weekly, Monthly, and so on. You never have to work out which session the drawing describes.
Buy is the volume of the session's bars that closed above their open. Sell is the volume of the bars that closed below their open. A bar that closed exactly where it opened counts to neither side. Large numbers are shortened with K, M and B.
Delta is the balance between them: buying volume minus selling volume, divided by the two together, as a signed percentage with one decimal. A session with equal buying and selling reads close to zero; one dominated by up bars reads well above it.
This is a deliberately blunt measure, and it is worth being plain about what it is. Every trade has a buyer and a seller. What the label measures is whether the volume came from rising bars or falling bars. That is still useful: a session that fell while its delta stayed near zero is a different session from one that fell with a delta of minus forty percent.
The charts in this post show both kinds. The EURUSD week in the first figure fell with a delta of minus 15.4 percent: most of its volume came on falling bars. The GBPUSD week in the channel figure fell just as steadily, yet its label read Buy 181.93K, Sell 172.41K and a delta of plus 2.7 percent. Its up bars and its down bars carried almost the same volume; the falling bars simply moved further.
How the Session Is Chosen
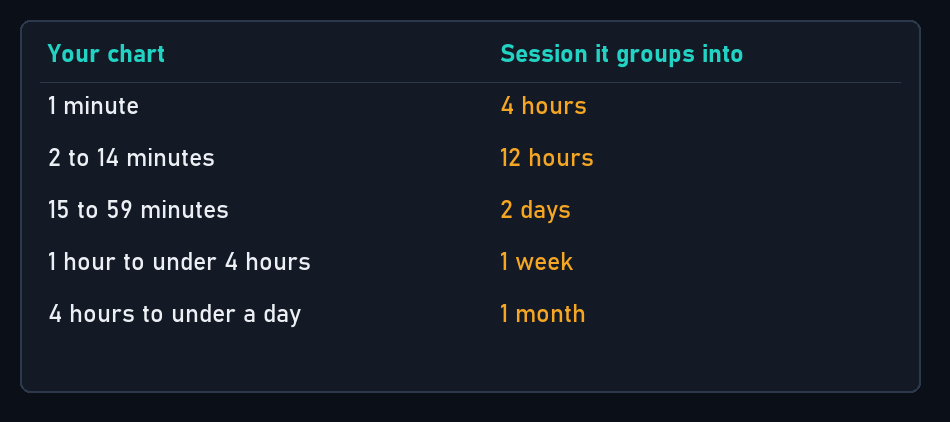
Illustration of the rule: with Auto Higher Timeframe on, the session follows from the chart you are on.
With Auto Higher Timeframe (true) the session is chosen from your chart: a 1 minute chart groups into 4 hour sessions, 2 to 14 minutes into 12 hours, 15 to 59 minutes into 2 days, 1 hour to under 4 hours into a week, and 4 hours to under a day into a month.
Turn it off and type your own in Manual Higher Timeframe (D): minutes as a number, such as 240, or D, W, 2M and so on. A longer session gives a broader, slower picture; a shorter one more sessions and quicker change.
One case to know: on a daily chart, Auto resolves the session to a day as well. Each bar is then its own session, there is nothing to fit, and the profile, the Point of Control and the channel do not appear; the high, low, midpoint and label still do. On a daily chart, switch Auto off and type a longer session yourself, W or 2M for example.
What Moves and What Does Not
The session in progress is recalculated on every tick. On the forming bar, the channel, the bins, the Point of Control, the session high and low, the extensions and the label all move as new prices and volume arrive. That is what reading a live session means, and it is said plainly here rather than left to be discovered: nothing about the current session is fixed until it ends.
A completed session never changes again. When a session ends, its drawings are fixed on its closed bar and kept exactly as they were. The sessions behind the current one are a record, not a moving picture.
The indicator reads your broker's tick volume. On most forex symbols that is a count of price changes, not of contracts, and two brokers will not report the same count for the same bar. The shape of a profile is generally similar from feed to feed; the numbers on the label are not identical.
The forward extensions are drawn past the last bar by design. Give the chart room on the right with the terminal's chart shift control if you want them clear of the candles.
Settings That Change the Picture
Five settings change what you see more than the rest.
Channel Width (1.0) is how many standard deviations each edge sits from the fit. Wider holds more of the session inside the channel, so more bars are binned and the profile fills out. Narrower bins only the bars that kept close to the trend. At zero the channel collapses onto its fitted line, nothing can be binned, and the profile and Point of Control disappear.
Bin Count (30) is how many slices the channel is cut into, from 5 to 100. More bins give finer detail and a noisier staircase; fewer give a blunter shape that is quicker to read.
Profile Max Width (15) is how many bars wide the fullest bin is drawn. It is cosmetic: it changes no measurement, only how far the staircase reaches into the session.
Max Completed Sessions (10) is how many finished sessions stay on the chart, from 1 to 50.
Manual Higher Timeframe (D), with Auto off, is the session itself. This one changes everything, because every number on the chart is a description of the session it names.
The indicator and both of its editions are the same calculation:
A free demo of each can be tried in the Strategy Tester from its product page before buying.
Worked Example
Take the EURUSD H1 chart in the first figure, at the shipped defaults.
The chart is one hour, so Auto picks a week, and the label's first line reads Weekly. The session in progress began on the Monday, and the capture runs to the last bar of the Friday.
The closes of that week fell at a fairly steady rate, so the fitted line and the channel slope down, and the profile and Point of Control are drawn in the bearish colour. The completed week to its left leaned slightly the other way, so its Point of Control is drawn in the bullish colour.
The label reads Buy 124.79K and Sell 170.28K. Delta is 124.79K minus 170.28K, which is minus 45.49K, divided by the two together, 295.07K: minus 15.4 percent, which is exactly what the label prints. The up bars of the week carried well under half of its volume.
The session high sat near 1.1251 and the low near 1.1018, so the dashed midpoint is drawn near 1.1135, and all three run forward past the last bar.
So the readable summary is: a week that trended down at a fairly steady rate, with more of its volume on falling bars than on rising ones, and with its busiest bin near the middle of the channel, along the path the closes kept following. That is the whole measurement. Nothing in it says what the next week will do.
Ten-Second Read
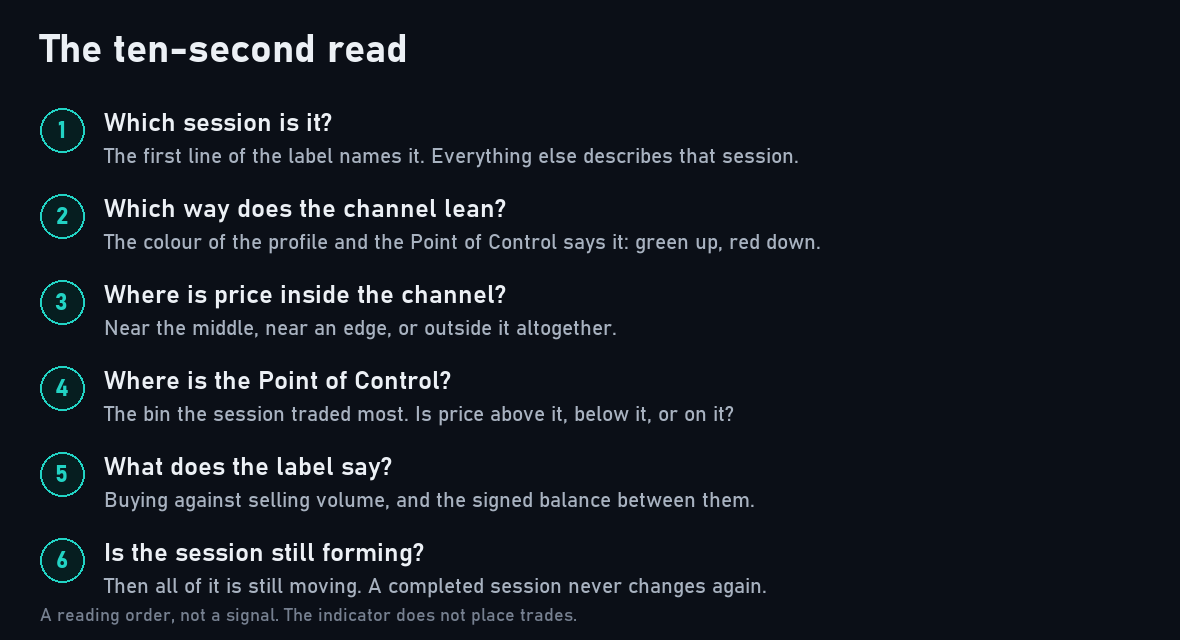
The six things worth checking first, in order.
- Which session is it? The label's first line says it, and everything else describes that session.
- Which way does the channel lean? Green profile and Point of Control for up, red for down.
- Where is price inside the channel? Near the fitted line, near an edge, or outside it altogether.
- Where is the Point of Control? Is price above the session's busiest path, below it, or on it?
- What does the label say? Buying against selling volume, and how far the delta is from zero.
- Is the session still forming? Then all of it is still moving. A completed session is fixed.
Mistakes
Reading a bin as a price. A bin is a position inside the channel, not a price level. On a trending session the same bin covers very different prices at the start and at the end of the session, which is the point of the design.
Treating the Point of Control as a signal. It is the session's busiest path and nothing more. Its colour is the channel's direction, not an instruction to buy or sell.
Forgetting the session is still forming. Everything the current session draws moves until the session ends. A Point of Control you noted at the start of the week may not be the Point of Control by Friday.
Expecting the profile and the label to add up. The label counts every bar of the session. The profile counts only the bars whose close lies inside the channel. Any part of the session that closed outside it is on the label but not in the bins.
Leaving Auto on a daily chart. The session becomes a single day, every bar is its own session, and there is no channel or profile to read. Type a longer session yourself.
Comparing sessions of different lengths. A 12 hour session and a weekly session are two different measurements, and their channels, profiles and deltas are not comparable.
What It Does Not Do
It does not place trades. It measures and draws; every order is yours.
It gives no buy or sell signal at all. There are no arrows, no entries, no stops, no targets and no alerts. The channel edges, the Point of Control, the session high and low and the midpoint are reference levels, not instructions, and what they mark is not a forecast.
It does not see the future. The current session is recalculated on every tick and settles only when the session ends.
It keeps no record of outcomes, and none is reported anywhere.
Conclusion
A volume profile is a measurement, not a method. What Helix Volume Profile measures is clearly defined: a log-linear channel fitted to one higher-timeframe session, the session's volume binned across that channel rather than across flat prices, the busiest bin marked as a leaning Point of Control, the session's high, low and midpoint, and the balance between buying and selling volume.
Everything in the picture follows from those rules, and nothing in it is an opinion about what happens next. Used that way, as a map of where a trending session has already done its business, it is a useful thing to have beside the candles.
Risk Disclaimer
Trading leveraged products carries a high level of risk and may not be suitable for all investors. Helix Volume Profile is an analysis tool, not financial advice. It gives no signals and places no orders, and nothing it draws is a recommendation to buy or sell. Test it on a demo account first, and never risk money you cannot afford to lose.


