
An Expert Advisor shows a profit factor of 2.0. Is that enough to put it on a live FX account? Before deciding, ask what produced the number. A handful of trades, one unusually large winner, or a change in position size can all make the same headline statistic tell a different story. This review gives you a practical way to inspect the evidence behind the ratio.
Start with the two totals
An Expert Advisor, or EA, is a program that implements trading rules. Profit factor compares the money made by winning trades with the magnitude of money lost by losing trades. Using positive amounts for both totals, the calculation is gross profit divided by gross loss. MetaTrader 5 defines the measure in its official testing-report guide.
For your own audit, choose one consistent result per completed trade after the costs you intend to include. Add the positive results, add the magnitudes of negative results, and divide. Reconcile that calculation with the platform report, checking how commissions and swaps are represented. A ratio above one means the selected profits exceed the selected losses over that sample. It does not describe how the next trade will behave.
The same ratio can rest on very different samples
Consider two hypothetical fixed-size tests in a USD account. Test A contains six winners of USD 100 and four losers of USD 75. Gross profit is USD 600, gross loss is USD 300, and profit factor is 2.00. Test B contains sixty winners of USD 100 and forty losers of USD 75. Its totals are USD 6,000 and USD 3,000, also producing 2.00. These examples assume each result already includes all modeled trading costs.
Now append one additional hypothetical loss of USD 150 to each test. Test A becomes 600 divided by 450, or about 1.33. Test B becomes 6,000 divided by 3,150, or about 1.90. The extra loss changes the smaller sample much more. This is a sensitivity exercise with invented outcomes. It demonstrates the arithmetic without estimating the probability of either test succeeding.
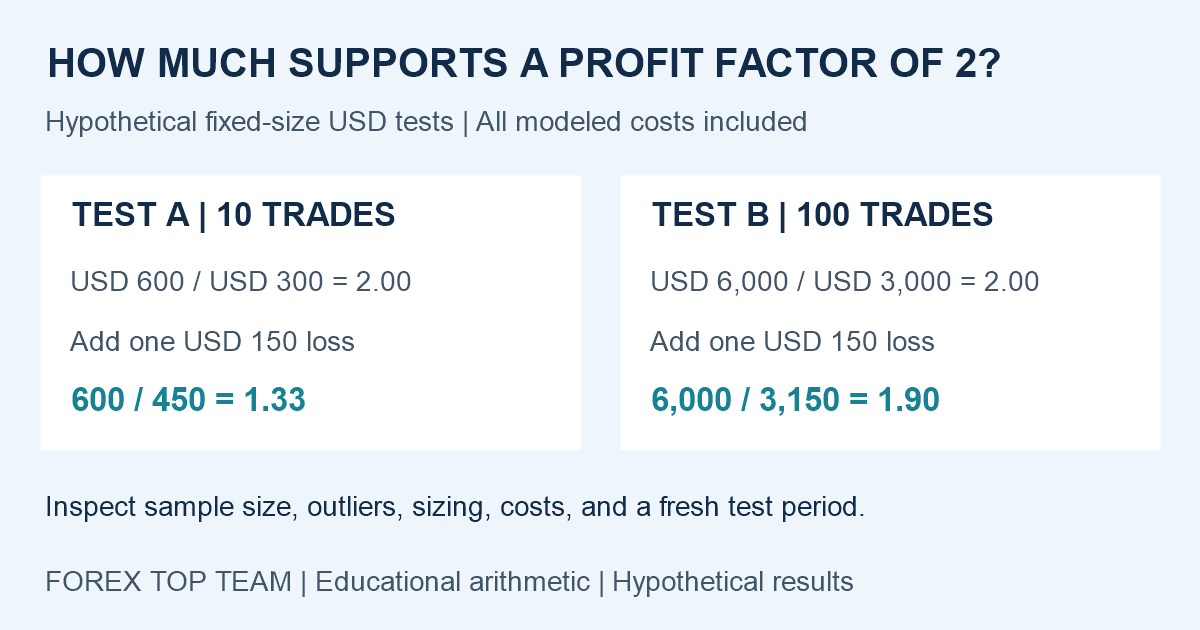 Hypothetical sensitivity exercise. All modeled costs are included.
The longer test still deserves questions. One hundred trades generated during the same brief market episode can provide less variety than the count suggests. Ten entries triggered by one dollar move may share much of the same risk. Record the calendar span, sessions, currency pairs, and overlap between positions alongside the trade count.
Measure dependence on the largest winner
A second hypothetical test contains USD 1,200 of total winning results and USD 600 of total losing results. Its profit factor is 2.00. Suppose its largest winner contributed USD 700. Removing that trade for a diagnostic calculation leaves USD 500 divided by USD 600, or about 0.83. The original result remains the actual result of that test. The diagnostic shows how strongly the conclusion depends on one observation.
A strategy designed to follow long trends may reasonably depend on occasional large winners. The next question is whether the test covers enough opportunities for those trends to appear, and whether the entry and exit rules could capture them in real time. Save both calculations and investigate the trade. Avoid repeatedly trimming inconvenient results until the remaining history looks comfortable.
Keep sizing and unfinished positions visible
Cash profit factor weights larger positions more heavily. If an EA doubled its size near the end of a favorable run, its dollar totals reflect that decision. Compare the position-sizing rules across tests. You can also examine trade outcomes in units of initial planned risk, often called R, provided that every trade has a meaningful initial risk definition. Keep that supplementary calculation clearly labeled because it answers a different question from the cash ratio.
Review open positions at the test endpoint as well. A summary built only from completed trades can look attractive while a remaining position carries a substantial floating loss. Check equity, which includes the current account value with open-position results, and inspect how the tester handles the end of the run. A favorable ratio can coexist with a difficult path through the sample.
Give the rules a fresh period
Parameter selection adds another layer. If you compare hundreds of settings and keep the highest profit factor, that winner was selected using the same history you are evaluating. Write down the search range and retain the broader results. Then freeze the rules and evaluate them on a later period that played no part in choosing them.
MetaTrader provides a forward-testing feature that separates an optimization period from a subsequent checking period. The mechanics are described in its strategy-optimization documentation. This separation helps you ask whether the chosen settings continue to behave as expected. A single forward period can still be unrepresentative, and changing settings after inspecting it turns that period into part of the selection process.
For the next review, save the trade list, cost assumptions, sizing rules, test dates, largest-winner contribution, equity drawdown, and any untouched checking period. Recalculate the ratio after one additional plausible loss and explain why you chose that loss size. Use several stress amounts when the historical record leaves the tail uncertain.
The related guide Why a High FX Win Rate Can Still Lose connects trade frequency with average gains, losses, and costs. Read the two measures together. The review is complete when you can explain which trades generated the attractive number, how concentrated those outcomes were, and what evidence would make you reconsider the strategy.



