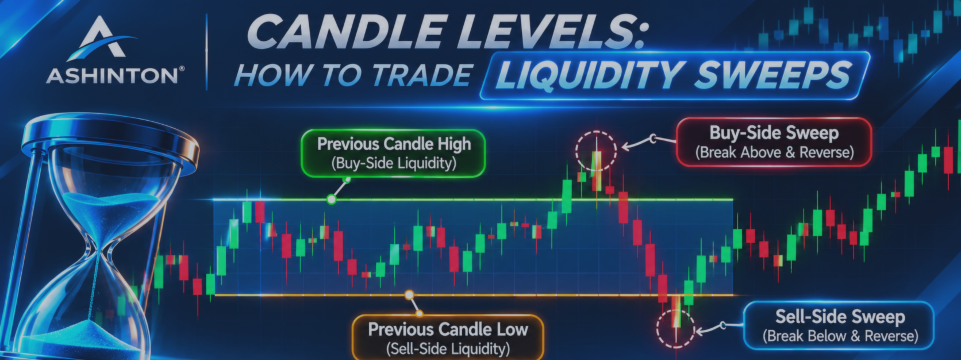

Understanding how price interacts with previous candle highs and lows can provide valuable insight into market behaviour.
Have you ever watched price break above a previous candle high, only to reverse sharply moments later? Or seen price push below a previous low before recovering and moving in the opposite direction?
These movements are commonly associated with liquidity sweeps.
Previous candle highs and lows are closely watched by traders because they represent identifiable price boundaries. Orders, including stop-loss orders and breakout entries, may accumulate around these areas. When price moves beyond these boundaries and quickly reverses, it can create a potential trading opportunity.
In this article, I'll explore how to identify liquidity sweeps using candle levels, what confirmation to look for and how to approach these setups with a structured trading plan.
1. What Is a Liquidity Sweep?
A liquidity sweep occurs when price moves beyond a significant high or low, potentially triggering orders positioned around that level.
For example, consider a previous daily candle with:
- High: 1.10500
- Low: 1.09800
These levels establish a visible trading range. If price moves above 1.10500, it may trigger buy-stop orders and stop-loss orders from traders holding short positions. However, if price fails to sustain the move and subsequently returns below 1.10500, traders may interpret this as a potential buy-side liquidity sweep.
The opposite can happen below the previous candle low.
It's important to understand that a liquidity sweep is an interpretation of price behaviour, not proof that institutional participants deliberately targeted a particular group of orders.
2. Understanding Buy-Side and Sell-Side Liquidity
There are two common liquidity areas traders monitor.
Buy-Side Liquidity (BSL)
Buy-side liquidity is commonly associated with orders resting above identifiable price highs. Examples include:
- Previous candle highs.
- Previous daily highs.
- Previous weekly highs.
- Equal highs.
- Clearly defined resistance levels.
When price moves above one of these levels and then reverses, traders may look for a bearish trading opportunity.
Sell-Side Liquidity (SSL)
Sell-side liquidity is commonly associated with orders resting below identifiable price lows. Examples include:
- Previous candle lows.
- Previous daily lows.
- Previous weekly lows.
- Equal lows.
- Clearly defined support levels.
When price moves below one of these levels and subsequently recovers, traders may look for a bullish trading opportunity. These levels are useful reference points, but neither a sweep nor a reversal is guaranteed.
3. How to Trade a Buy-Side Liquidity Sweep
A buy-side liquidity sweep occurs when price trades above a previously established high and then potentially reverses. Consider the following example:
Previous daily candle:
- High: 1.10500
- Low: 1.09800
Price subsequently rallies above 1.10500, reaching 1.10650. Instead of continuing higher, price loses momentum and a candle closes back below 1.10500. A trader looking for a bearish setup may follow this process:
Step 1: Identify the previous candle high.
Mark the high of a completed daily or higher-timeframe candle.
Step 2: Wait for price to trade above the level.
Allow price to move beyond the established high. Avoid assuming that every approach to the level will produce a sweep.
Step 3: Look for rejection and re-entry.
Watch for price to return below the previous high. A candle closing back inside the original range can provide useful confirmation.
Step 4: Seek lower-timeframe confirmation.
Some traders move to M15 or M5 to observe bearish market structure, a change in momentum or another confirmation signal.
Step 5: Define risk and target.
Establish the invalidation point and stop-loss before entering. Potential targets may include the opposite side of the original candle range or another relevant support area. The setup becomes more meaningful when the sweep is followed by clear bearish price behaviour rather than an immediate assumption that price must reverse.
4. How to Trade a Sell-Side Liquidity Sweep
The sell-side scenario follows the opposite logic. Imagine the previous daily candle established:
- High: 1.10500
- Low: 1.09800
Price drops below 1.09800, reaching 1.09650. However, selling pressure fails to continue. Price recovers and a candle closes back above 1.09800. A trader looking for a bullish setup may consider the following:
- Identify the previous candle low.
- Wait for price to trade below that low.
- Look for rejection and a close back inside the original range.
- Monitor lower-timeframe price action for bullish confirmation.
- Define the stop-loss, potential target and acceptable risk before execution.
The previous candle high may serve as a potential reference target, although market conditions and the trader's strategy should determine whether it is appropriate.
5. Why Higher-Timeframe Candle Levels Matter
Liquidity sweeps can occur around many different price levels, but higher-timeframe candle boundaries are particularly useful reference points for multi-timeframe analysis. A daily high or low may be relevant to traders operating on H4, H1, M15 or M5 charts.
Consider this practical workflow:
| Timeframe | Purpose |
|---|---|
| D1 | Identify previous daily candle high and low. |
| H4 | Monitor price interaction with daily levels. |
| H1 | Observe developing price structure. |
| M15 | Look for sweep, rejection and re-entry. |
| M5 | Refine execution where appropriate. |
The advantage is that traders can maintain awareness of important higher-timeframe levels while studying more detailed price behaviour on lower timeframes. This avoids repeatedly switching between charts to locate the same reference prices.
6. Liquidity Sweep vs Genuine Breakout
One of the biggest challenges is distinguishing a potential liquidity sweep from a genuine breakout. Both can begin with price moving beyond a previous candle high or low. The difference becomes clearer through subsequent price behaviour.
Potential liquidity sweep:
- Price moves beyond a reference high or low.
- The breakout fails to sustain itself.
- Price returns inside the original range.
- Additional confirmation may indicate a reversal.
Potential genuine breakout:
- Price moves beyond the reference level.
- The market sustains trading beyond the boundary.
- Subsequent price action supports continuation.
- The former boundary may become a potential support or resistance area.
These are observations, not rigid rules. A market can reverse after a sustained breakout or continue after briefly returning inside a range. Avoid making decisions based on a single candle or price movement.
7. Common Mistakes When Trading Liquidity Sweeps
Entering immediately when a level is breached
A price break is not automatically a liquidity sweep. Wait for the market to show what happens after the breach.
Ignoring higher-timeframe context
A sweep on M5 may have limited significance if it occurs without consideration of the broader market structure.
Assuming every rejection will reverse
Price can reject a level and still continue in the original direction. Confirmation and invalidation rules matter.
Using arbitrary stop-loss placements
A stop-loss should reflect the setup's invalidation point and the trader's risk tolerance, not simply an arbitrary number of points.
Risking too much on one setup
Even a well-identified sweep can fail. Position sizing and consistent risk management remain essential.
8. Making Candle-Level Analysis Easier on MetaTrader 5
Manually identifying previous candle highs and lows across several timeframes can become repetitive. This is where a dedicated chart indicator can help.
Ashinton Candle Levels Pro, developed by Ashinton Capital (Pty) Ltd, is designed to display the highs and lows of previously closed candles from a selected reference timeframe directly on your active MetaTrader 5 chart.
Its features include:
- Multi-timeframe reference levels: Select a timeframe from M1 to MN1.
- Lower-timeframe visibility: Monitor higher-timeframe candle levels while analysing lower-timeframe charts.
- Historical candle selection: Display multiple previous closed candle ranges.
- Automatic updates: Refresh levels when a new reference-timeframe candle begins.
- Colour-coded levels: Lime green for highs and orange red for lows.
- On-chart dashboard: Monitor the selected timeframe, chart timeframe, symbol, indicator status and historical candle prices.
For traders who monitor previous daily, weekly or other higher-timeframe candle boundaries, the indicator provides a convenient way to keep these reference levels visible.
Instead of manually drawing and updating levels, you can focus on observing how price interacts with them.
https://www.mql5.com/en/market/product/206200



