
1. What Target Clock Pro does, and what it does not
Target Clock Pro answers one question: how likely is price to cover a given distance within the next hour, and within the next four hours?
You give it a distance, or it reads the TP and SL of your open position. It returns two calibrated probabilities and a one-line verdict. "Calibrated" has a precise meaning here: in the test data, when the indicator said 30%, the distance was reached about 3 times out of 10.
What it does not do:
- It does not predict direction. It measures how fast price travels, not which way it will go. A TP and an SL at the same distance get the same probability.
- It does not give entry signals. It is a measuring tool, like a ruler for time.
- It does not show horizons beyond 4 hours, because longer horizons were tested and add little over a simple ATR estimate (see section 8).
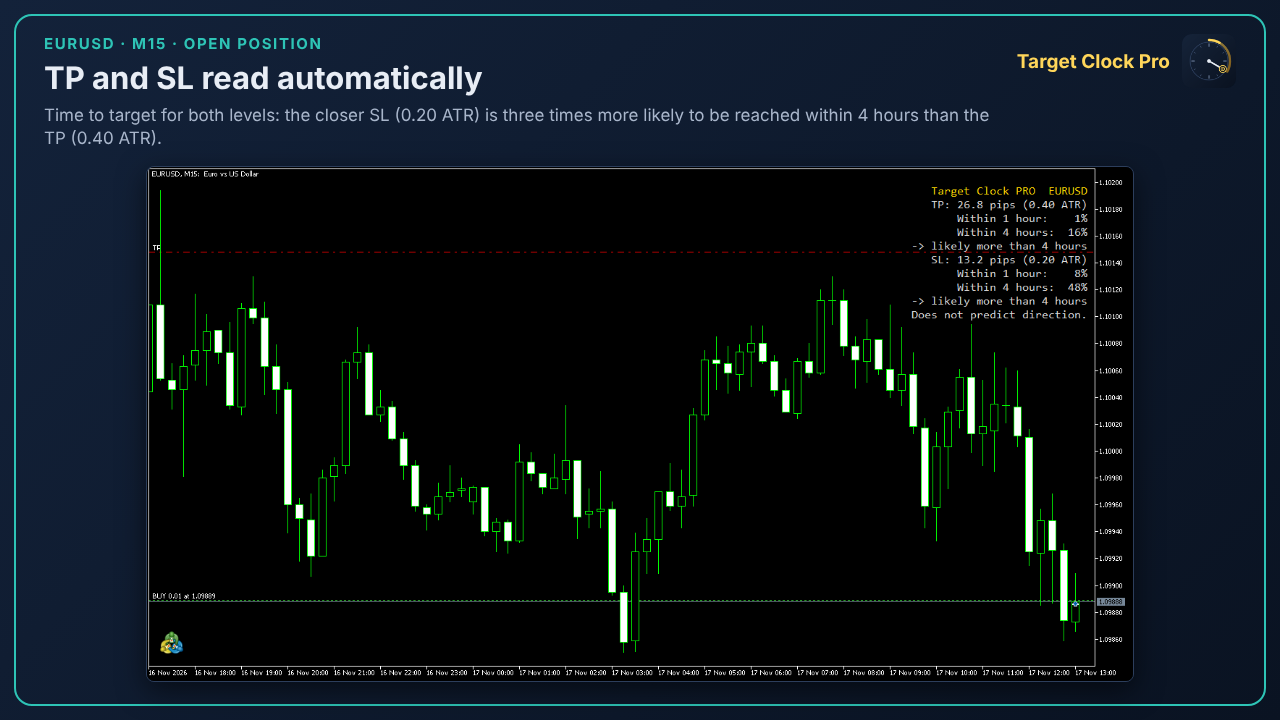
Fig. 1 - EURUSD M15 with an open position: the panel reads TP (0.40 ATR) and SL (0.20 ATR) automatically. The closer SL is three times more likely to be reached within 4 hours (48% vs 16%)
2. Installation and first run
- Attach Target Clock Pro to any chart. Any timeframe works: calculations always use M15 data of the chart symbol.
- Leave the default settings and set Target distance to the move you care about (for example 20).
- Wait a few seconds. On the first run the indicator loads up to 3 years of M15 history and builds the intraday profile of the symbol. While this happens the panel shows "Loading M15 history...".
Requirements:
- At least 250 trading days of M15 history on the symbol. With less, the panel shows "Not enough history" and computes nothing. MetaTrader downloads the history automatically; if it is slow, open an M15 chart of the symbol and scroll back once.
- The panel refreshes every 5 seconds. The intraday profile is rebuilt once a day; the volatility level is updated at every closed M15 bar.
- No other product is needed.
3. Reading the panel
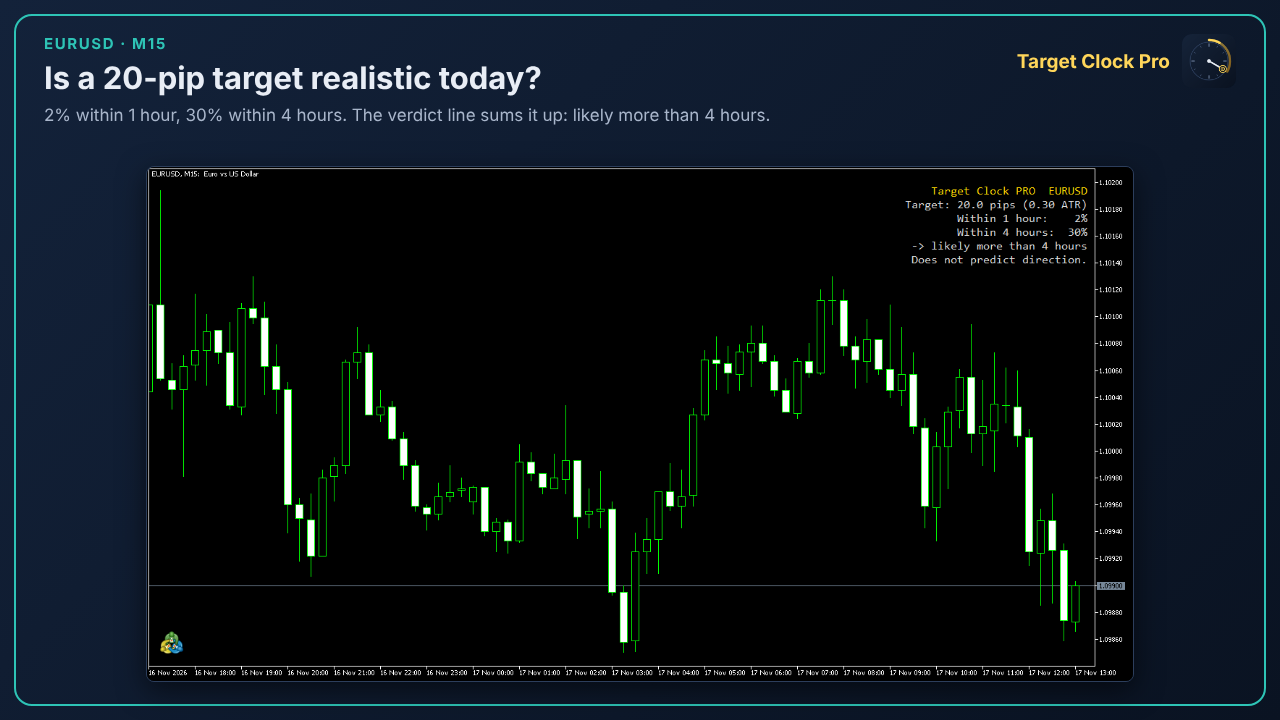
Fig. 2 - A 20-pip target on EURUSD (0.30 ATR): 2% within 1 hour, 30% within 4 hours. The verdict line sums it up: likely more than 4 hours
| Line | Meaning |
|---|---|
| Target: 20.0 pips (0.30 ATR) | The distance, in your unit and as a fraction of the daily ATR(20) of the previous days |
| Within 1 hour: 2% | Probability that price touches that distance in one direction within the next hour |
| Within 4 hours: 30% | The same within the next four hours |
| -> likely more than 4 hours | Verdict: "within 1 hour" if the 1-hour probability is 50% or more; "between 1 and 4 hours" if only the 4-hour one is; otherwise "more than 4 hours" |
| Does not predict direction | A reminder, always shown |
Three special messages:
- outside the verified range (0.10-1.00 ATR): the distance is shorter than 0.10 or longer than 1.00 daily ATR. Probabilities were tested only inside that range, so the panel shows no number.
- check the distance unit: added when the distance is below 0.01 ATR, which almost always means a wrong unit (see section 4).
- n/a (market closed): the window crosses a market close, such as the weekend or the daily break of indices and metals. The model was not tested across closures, so it does not guess.
The verdict uses the 50% line. With 49% within 4 hours the verdict is still "more than 4 hours": it means "less than even odds", not "impossible".
4. Distance units
The default unit is auto, which picks the unit traders normally use on each symbol:
| Symbol type | Auto unit | Example: distance 20 means |
|---|---|---|
| Forex pairs (EURUSD, USDJPY, ...) | pips | 20 pips |
| Indices (US500, DE40, ...) | price units | 20 index points |
| Metals (XAUUSD, XAGUSD) | price units | 20 dollars on gold |
| Energy (WTI, Brent) | price units | 20 dollars |
You can force a unit with the Distance unit setting: pips, points (the broker's smallest price step) or price units.
If you see "check the distance unit", the distance is tiny compared with the daily range. The usual cause is a forced unit that does not fit the symbol, such as "points" on an index, where one point is 0.01.
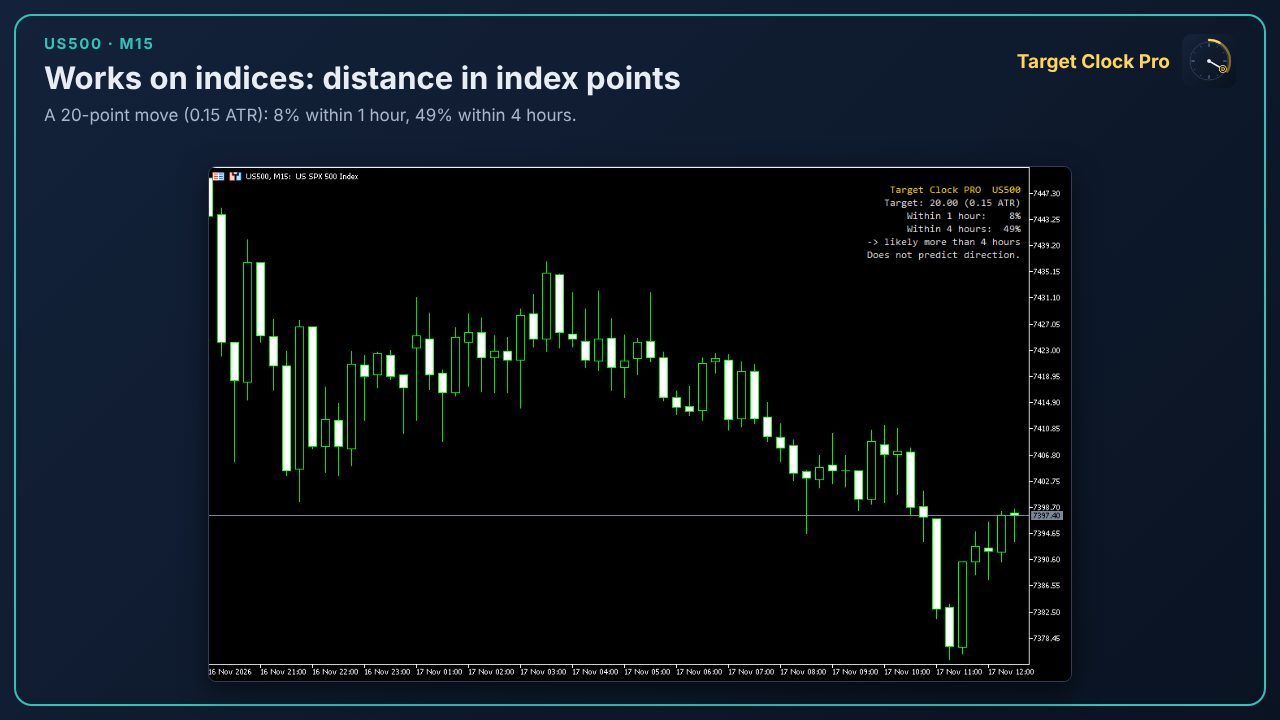
Fig. 3 - US500 with the auto unit: the distance is read in index points. 20 points (0.15 ATR): 8% within 1 hour, 49% within 4 hours
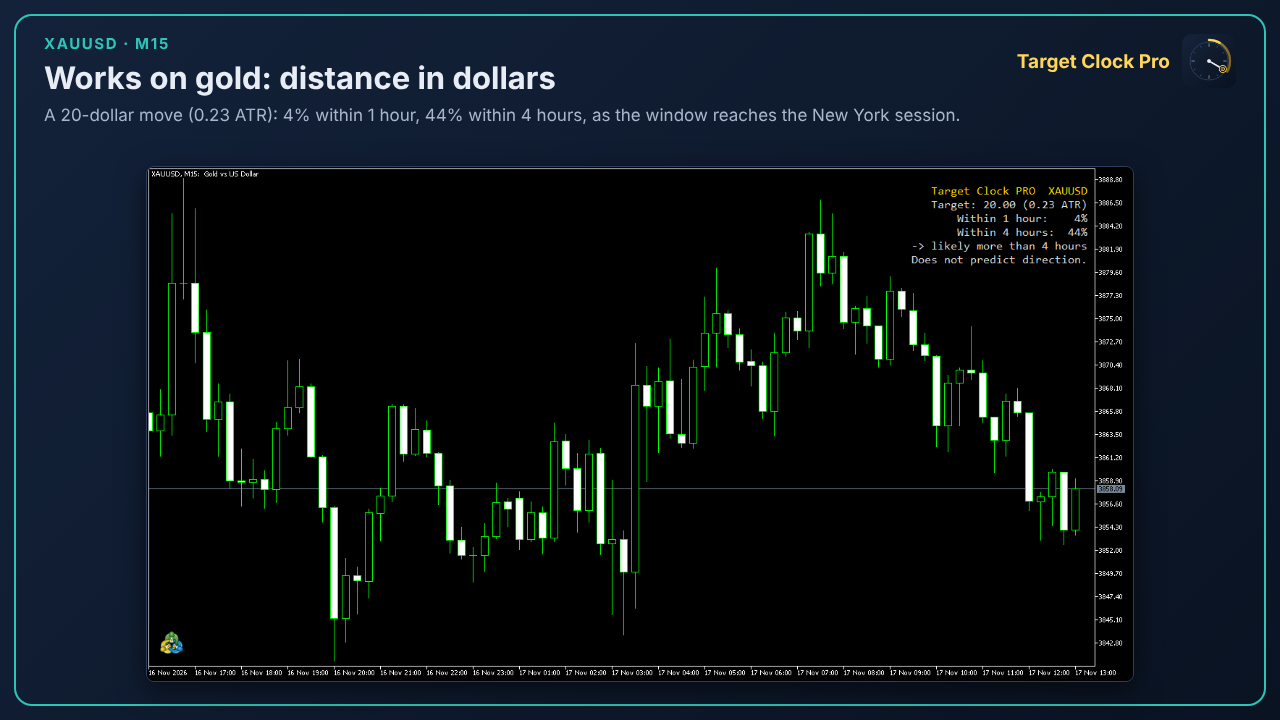
Fig. 4 - Gold with the auto unit: the distance is read in dollars. 20 dollars (0.23 ATR): 4% within 1 hour, 44% within 4 hours
5. Using it with an open position
With Use TP and SL of the open position set to true (default), the indicator checks whether you have a position on the chart symbol. If you do, it replaces the manual distance with two blocks:
- TP: distance from the current price to your take profit, with its two probabilities
- SL: distance from the current price to your stop loss, with its two probabilities
Distances are measured from the current price, so they change as price moves. Without a TP or SL, that block is not shown; with neither, the panel goes back to the manual distance.
The example in Screenshot 1 (section 1): TP at 0.40 ATR, SL at 0.20 ATR.
How to read it: the probabilities of TP and SL are not "which one comes first". Each is the probability that price reaches that level within the window, considered alone. A closer SL simply gets reached more often. If you need the probability that TP comes before SL, that is a different question, answered by a different tool.
6. Settings
| Setting | Default | Description |
|---|---|---|
| Target distance | 20 | The distance to evaluate, in the chosen unit |
| Distance unit | auto | auto, pips, points or price units (section 4) |
| Use TP and SL of the open position | true | Reads TP and SL of the position on the chart symbol (section 5) |
| Years of M15 history for the intraday profile | 3 | How much history builds the 96-quarter-hour profile |
| Panel corner, horizontal and vertical offset | top right, 10, 20 | Panel position |
| Text color, title color, font size | light grey, gold, 9 | Panel style; use 11-12 on high-resolution screens |
| Print internal values in the Experts tab | false | Writes the internal values (volatility level, ATR, raw and calibrated probabilities) every 5 seconds, for checks |
The model itself has no tuning parameters: the calibration is fixed and is the one that was tested.
7. How the model works
The idea is simple: market time does not run at a constant speed. An hour around the New York open moves price much more than an hour of the late evening. Target Clock Pro measures time in expected volatility instead of minutes.
- Intraday profile. For each of the 96 quarter-hours of the server day, the indicator computes the average absolute M15 return over the last 3 years. This is the typical "speed" of the market at that time of day.
- Current level. It tracks how active the market is right now compared with its usual profile, with an exponential average whose half-life is 96 M15 bars (about one trading day).
- Expected variance. For the next 1 or 4 hours it adds up the profile of the coming quarter-hours and scales it by the current level. Four quiet hours add up to little; four hours that include a session open add up to a lot.
- Probability. It converts distance and expected variance into the probability of touching the level, with the classic first-passage formula of a random walk without drift.
- Calibration. Raw probabilities are mapped through a calibration table estimated on forex data from 2020-2021 and then frozen. The same table is used on every symbol.
The distance is also expressed in units of the daily ATR(20) of the previous days, only to check that it lies in the verified range.
8. How it was verified
Before any test, a written pre-registration fixed the model, the data, the metrics and the pass thresholds. Each test was run once, with code and data locked by checksums. The reference to beat was an ATR-only estimate: the historical frequency of reaching a distance, measured in daily ATR, within a given time, which is roughly what a trader estimates by eye.
Test 1: 21 forex pairs, 2022 to October 2026 (data never used to build the model)
| Horizon | Improvement over the ATR-only estimate (Brier skill score) |
|---|---|
| 1 hour | 0.073 |
| 4 hours | 0.049 |
| 8 hours | 0.033 |
| 24 hours | 0.010 |
Calibration error was between 0.004 and 0.007 on every horizon, and the model beat the ATR-only estimate on 21 pairs out of 21 and in each of the 5 years. Over all four horizons together, though, the improvement (0.035) missed the pre-registered threshold of 0.05: beyond 4 hours there is little to gain. That is why the indicator shows only 1 and 4 hours.
Test 2: 10 instruments never used before, 1 and 4 hours only (thresholds written before the data were exported)
| Instrument | Improvement over the ATR-only estimate |
|---|---|
| US500 | 0.135 |
| USTEC | 0.131 |
| US30 | 0.131 |
| WTI oil | 0.114 |
| DE40 | 0.095 |
| UK100 | 0.080 |
| Gold | 0.061 |
| JP225 | 0.058 |
| Silver | 0.056 |
| EURSEK | 0.041 |
Overall improvement 0.087 (95% interval 0.084-0.090, threshold 0.04); calibration error 0.007 at 1 hour and 0.011 at 4 hours (threshold 0.03). The calibration table estimated on forex worked on indices, metals and oil without any change. The gain is largest where the trading day has a strong hourly structure, such as the US cash open on indices.
What these numbers mean in practice: the probabilities are reliable, and they are clearly better than an ATR rule of thumb on short horizons. They are not a forecast of direction or of profit.
9. Practical uses
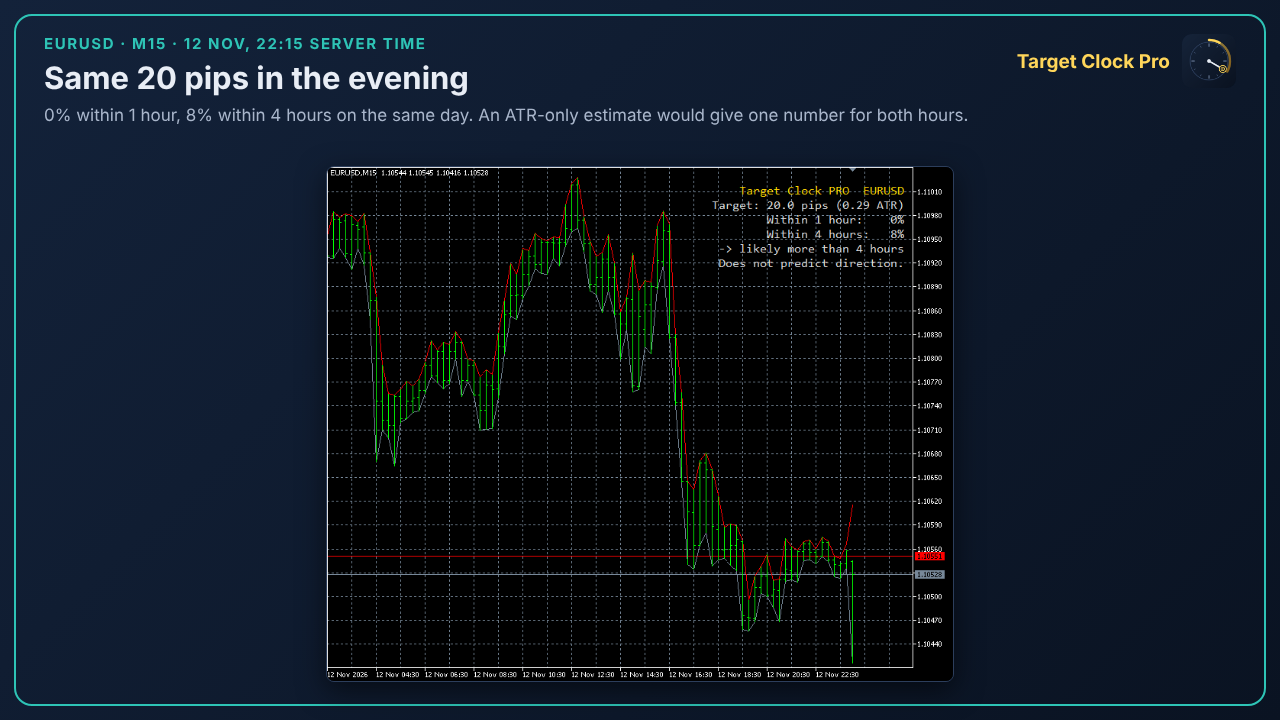
The same distance is not the same at every hour. These two screenshots show 20 pips on EURUSD on the same day: 27% within 4 hours at the New York open, 8% in the evening. An ATR-based rule gives one number for both.
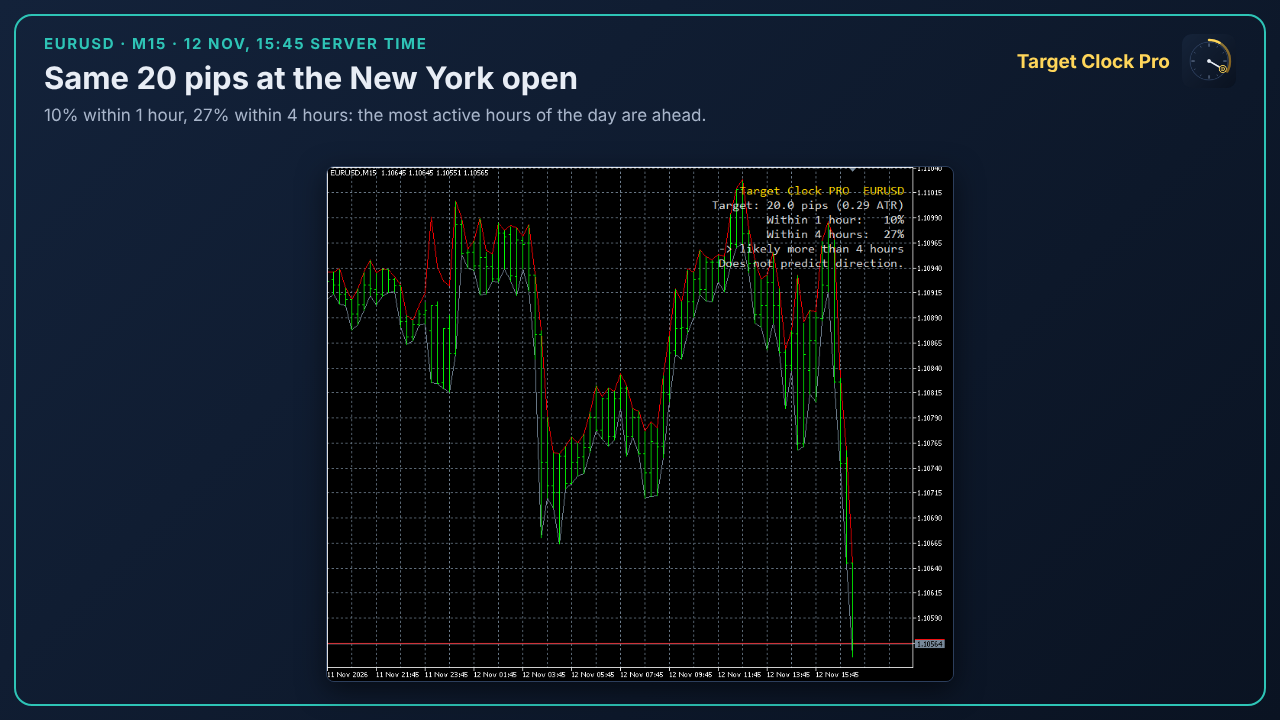
Fig. 5 - Same 20 pips on EURUSD at the New York open (12 Nov, 15:45 server time): 10% within 1 hour, 27% within 4 hours
- Before entering. Is an intraday target realistic? If the 4-hour probability is low and you plan to close by the end of the session, consider a closer target or a later entry.
- Keeping a trade into the evening. In the quiet hours the probability of reaching the TP drops sharply. Closing or reducing before the slow session can be a better use of capital than waiting.
- Comparing TP and SL. If your SL is far more likely to be touched within 4 hours than your TP, at least check that the stop is not inside the normal noise of the next hours.
- Time-based exits. If a trade has not reached its target when the remaining probability falls, a time exit has a measurable basis rather than a gut feeling.
- Across instruments. On indices the panel shows clearly how much the cash open changes the picture; on gold, how the New York session drives the 4-hour figure.
10. Limits and FAQ
Limits
- Verified for horizons of 1 and 4 hours and distances between 0.10 and 1.00 daily ATR. Outside these limits the indicator shows no number.
- Verified on historical data from one broker (M15, server time GMT+2/+3). Other brokers have similar data, but sessions, breaks and quotes can differ slightly.
- In the tests the intraday profile came from older years; the indicator uses the last 3 years and rebuilds it every day. Recent data should describe the market at least as well, but this exact setup is not the tested one.
- Scheduled news (central banks, NFP) can move price far more than the profile expects in that quarter-hour. The probabilities describe an average day at that hour, not a news release.
- It says nothing about direction, profit or the order in which TP and SL are reached.
FAQ
Why is the probability so low at night? Because historically the market moves little at those hours. The same distance that is likely during the New York session can be very unlikely after the US close.
Why do I see "outside the verified range"? The distance is shorter than 0.10 or longer than 1.00 daily ATR, or the unit is wrong. Check the unit first (section 4).
Why "n/a" on indices in the late evening? The 4-hour or 1-hour window reaches the daily break of the market. The model was tested only on windows without closures.
Does it work on M1, H1 or D1 charts? Yes. It always reads M15 data, whatever the chart timeframe.
Does it work on crypto or stocks? It was not tested on them. The panel will show numbers if the history is long enough, but they are not verified.
Can an EA read the values? Not in this version: the indicator draws a panel and has no buffers.
11. Links
- Product page: https://www.mql5.com/en/market/product/209215
- Related: ExitBand Pro, for the probability that TP comes before SL – User Manual: https://www.mql5.com/en/blogs/post/779158
- Related: VolBand Pro, calibrated volatility bands – User Manual: https://www.mql5.com/en/blogs/post/778651
Target Clock Pro is an analysis tool, not a signal or a trading system. Past calibration does not guarantee future results.