
JET Wyckoff Events PRO is a paid indicator for MetaTrader 5 that marks the Wyckoff method on the price chart: each trading range as a box between its support and resistance, the accumulation and distribution events with short labels (SC, AR, ST, Spring, SOS...) and phases A to E. The marks follow rules you can configure. It adds a panel with the current range, alerts on confirmed events and data for Experts. It works on futures and stocks of any exchange (e.g. B3, CME and others) with real volume and on forex, CFDs and metals with tick volume. It is an indicator only: it never opens, closes or changes orders.
What it shows
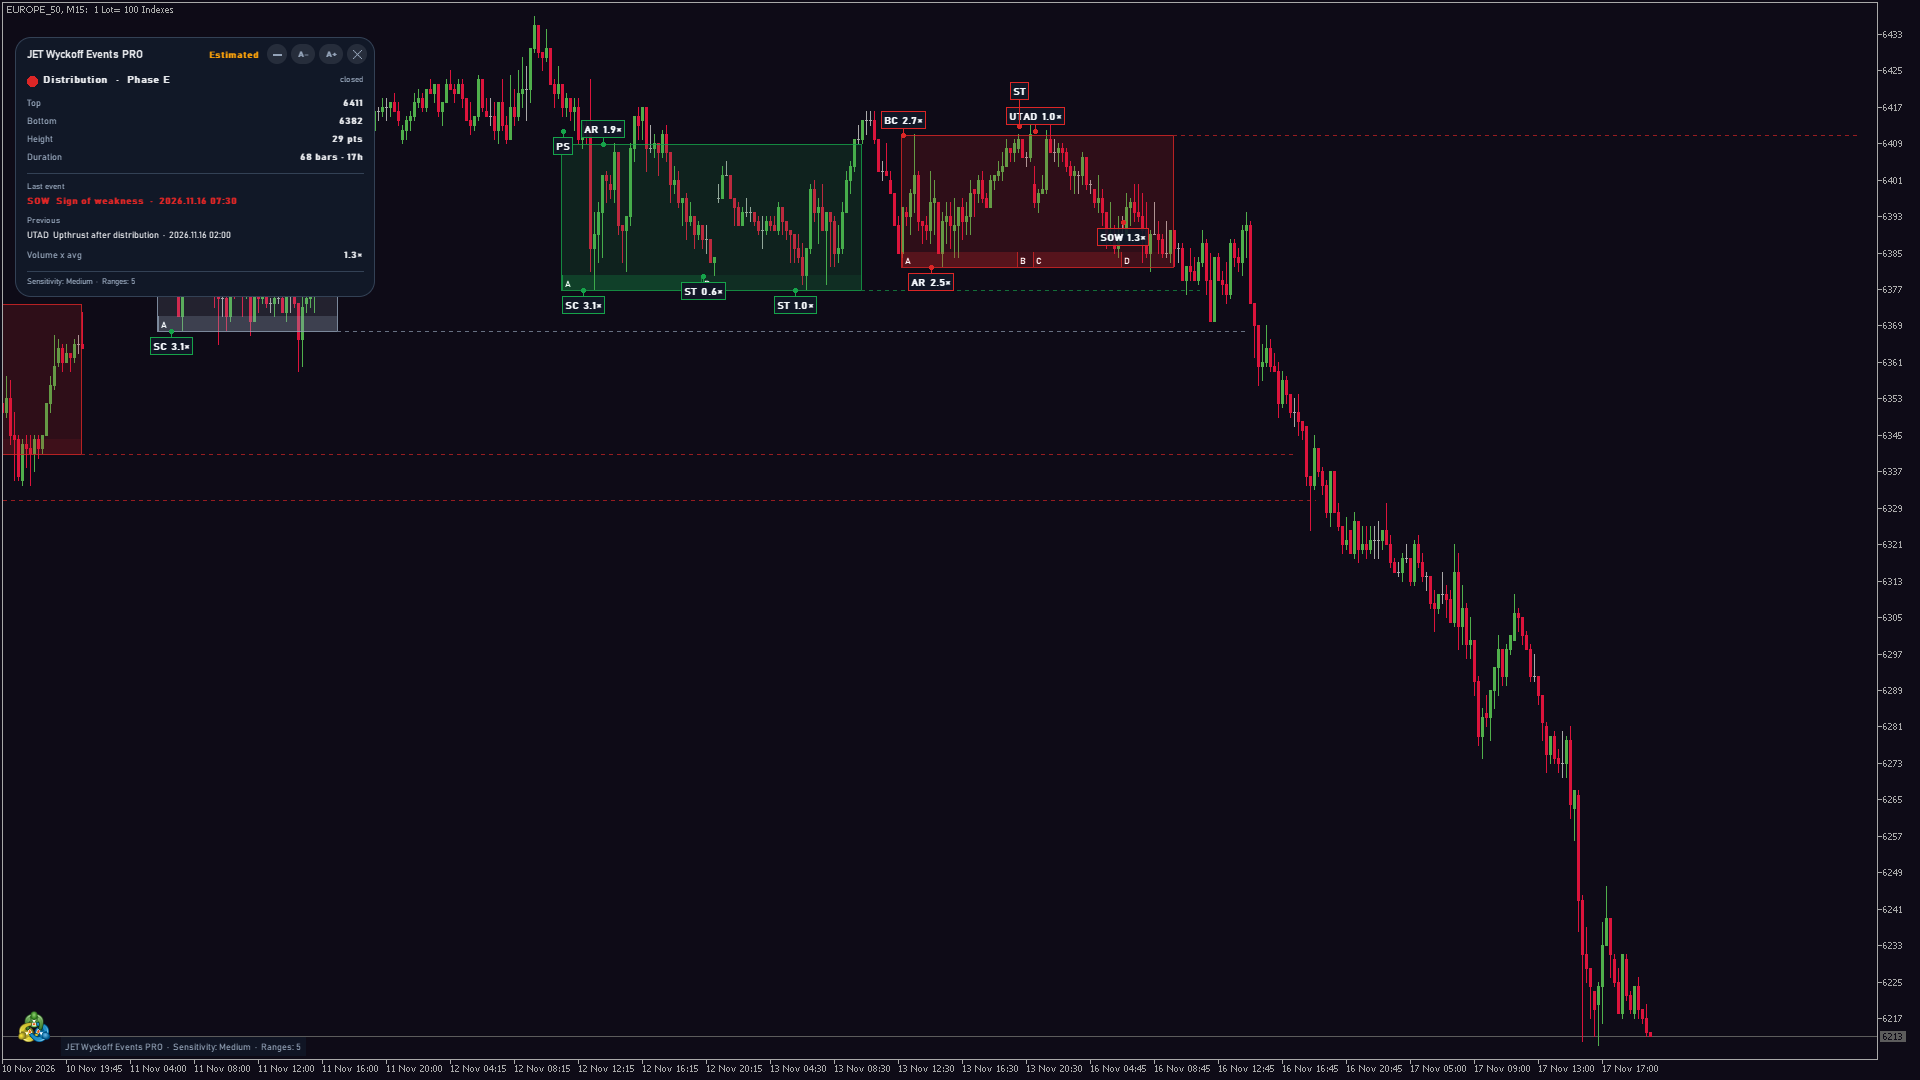
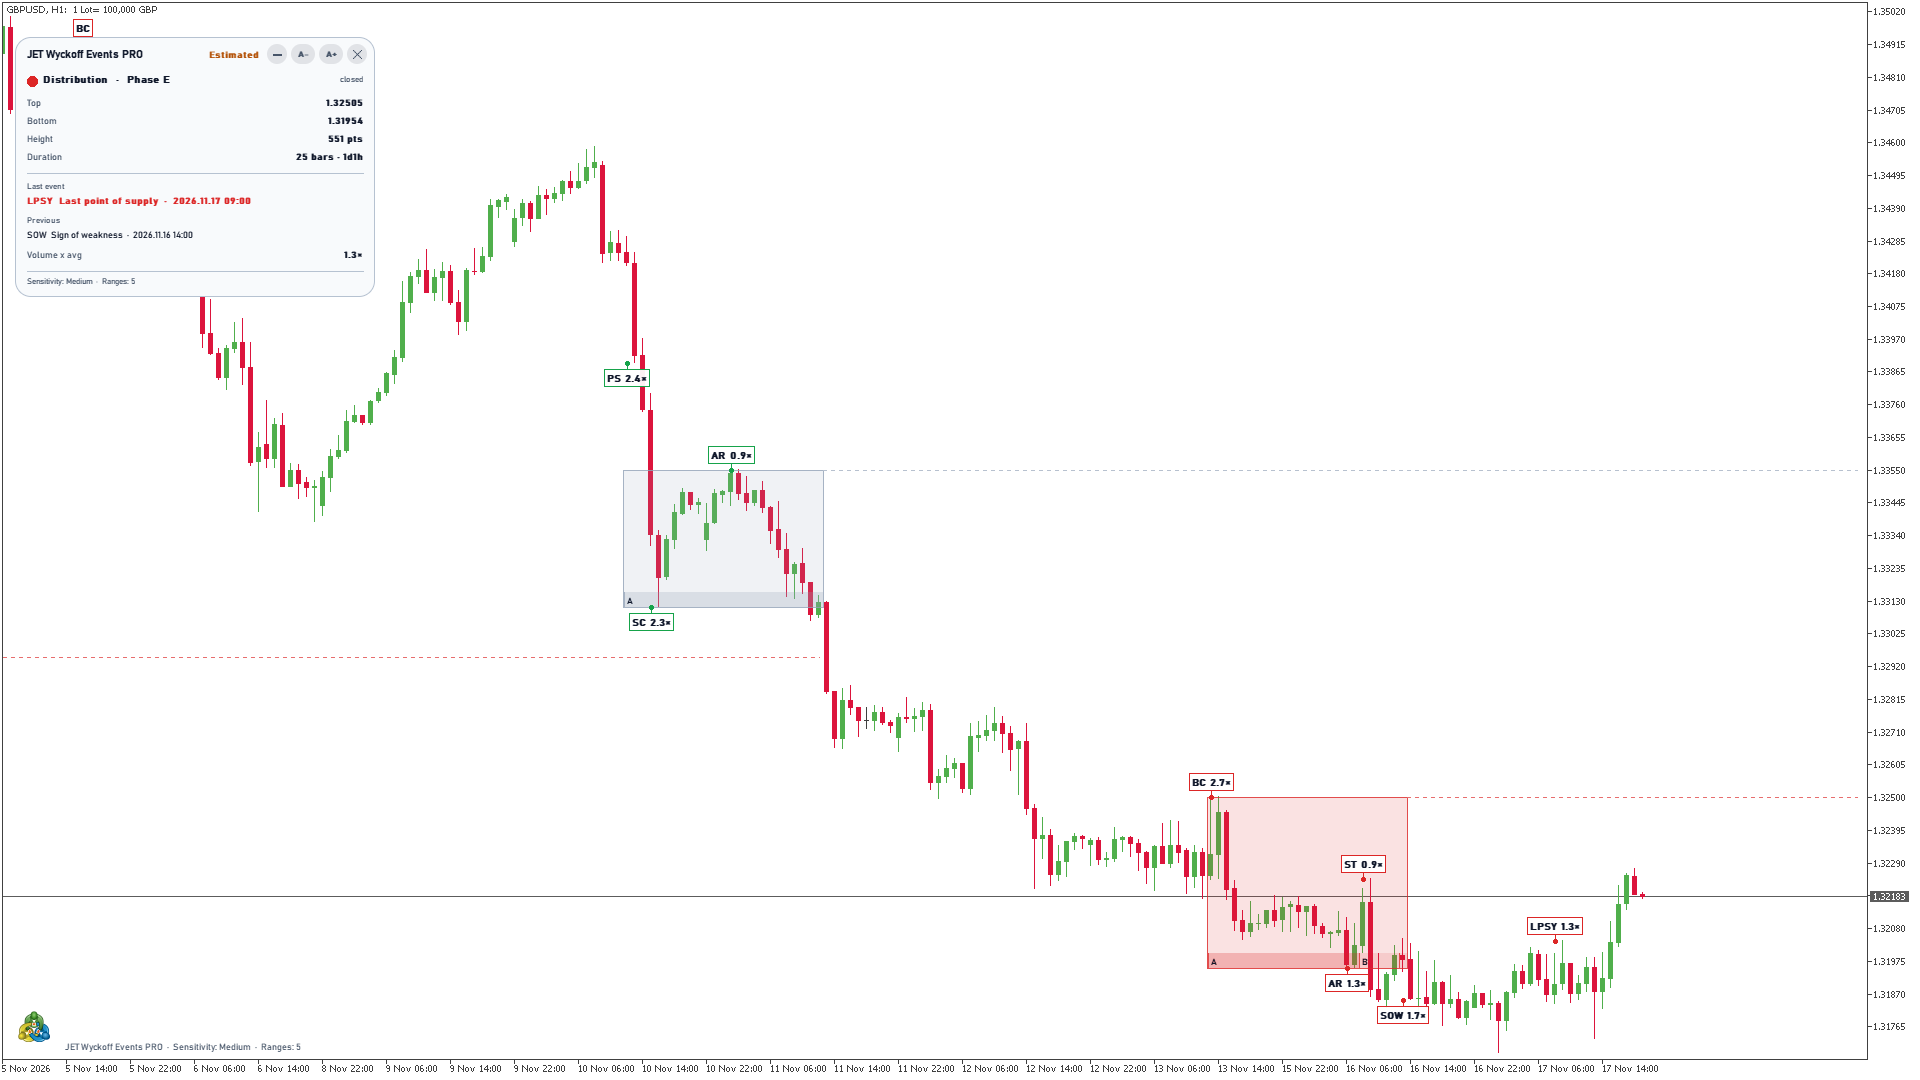
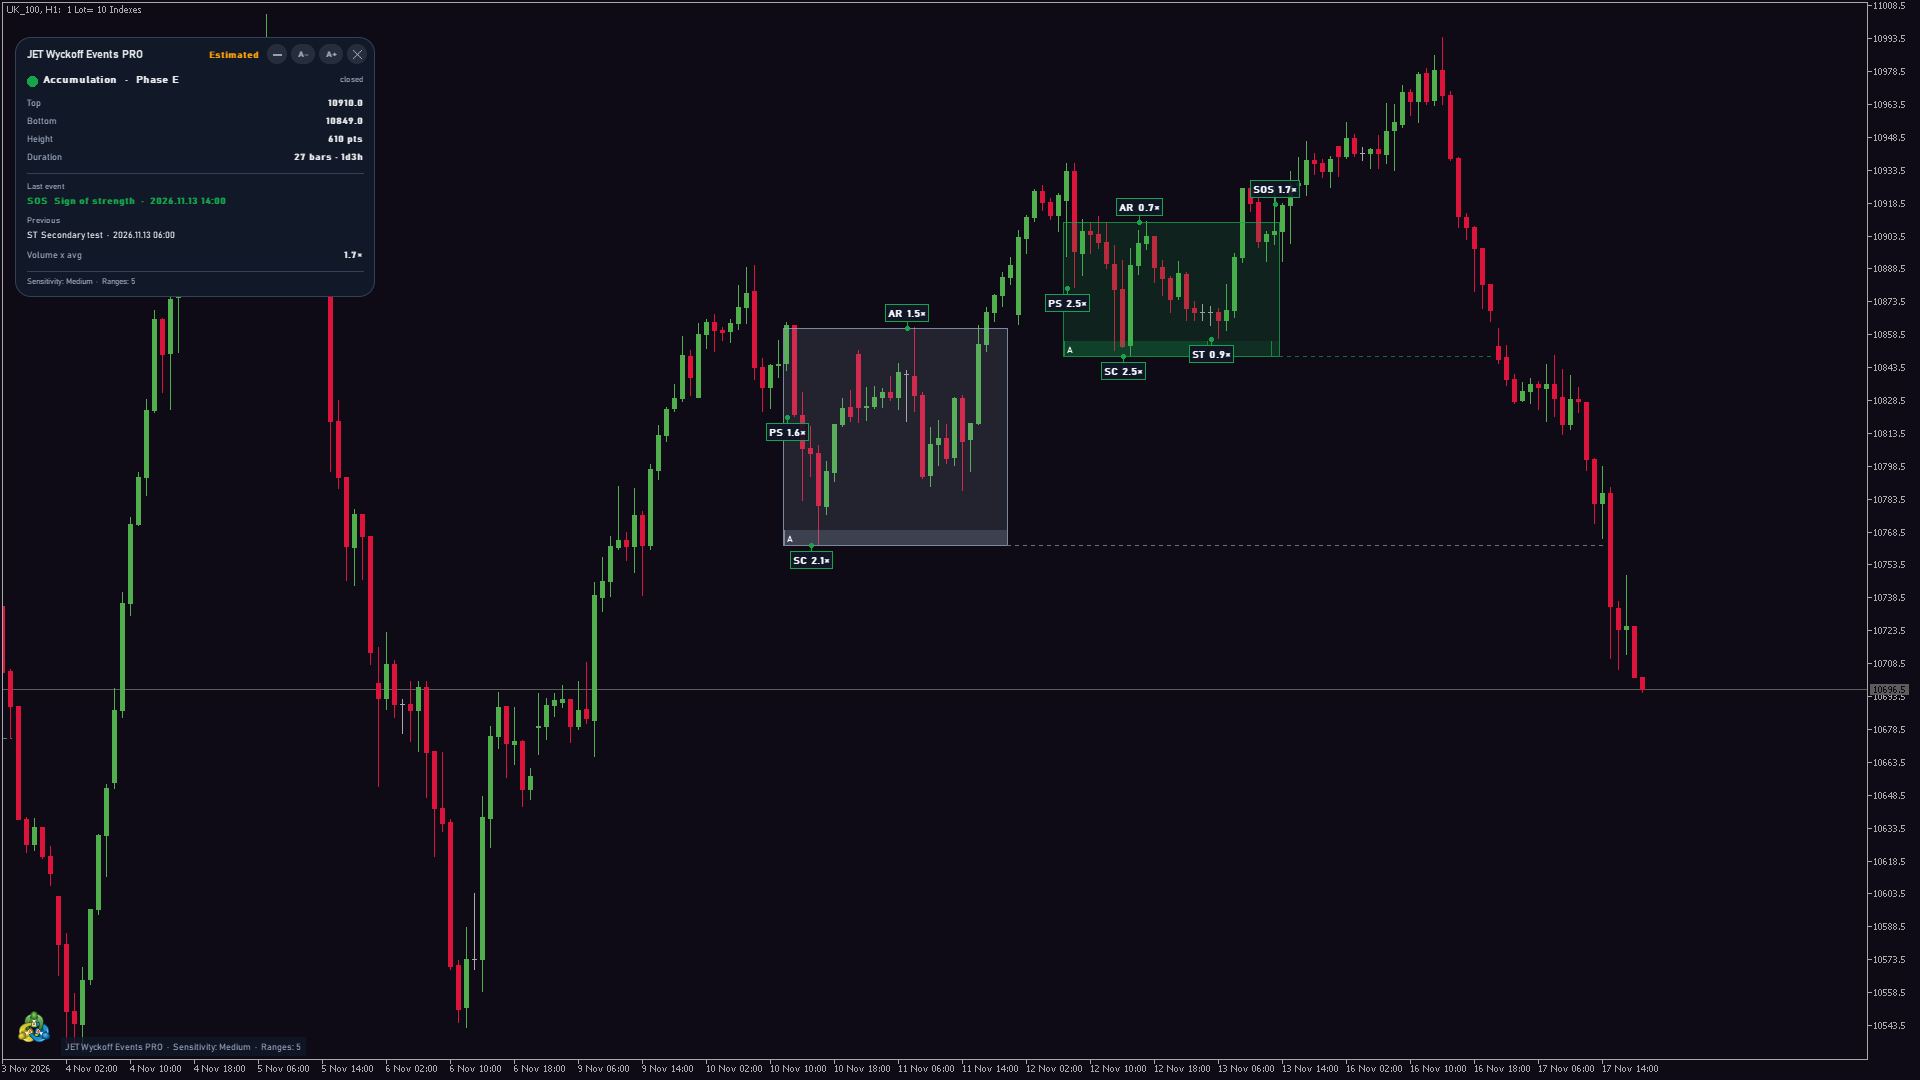
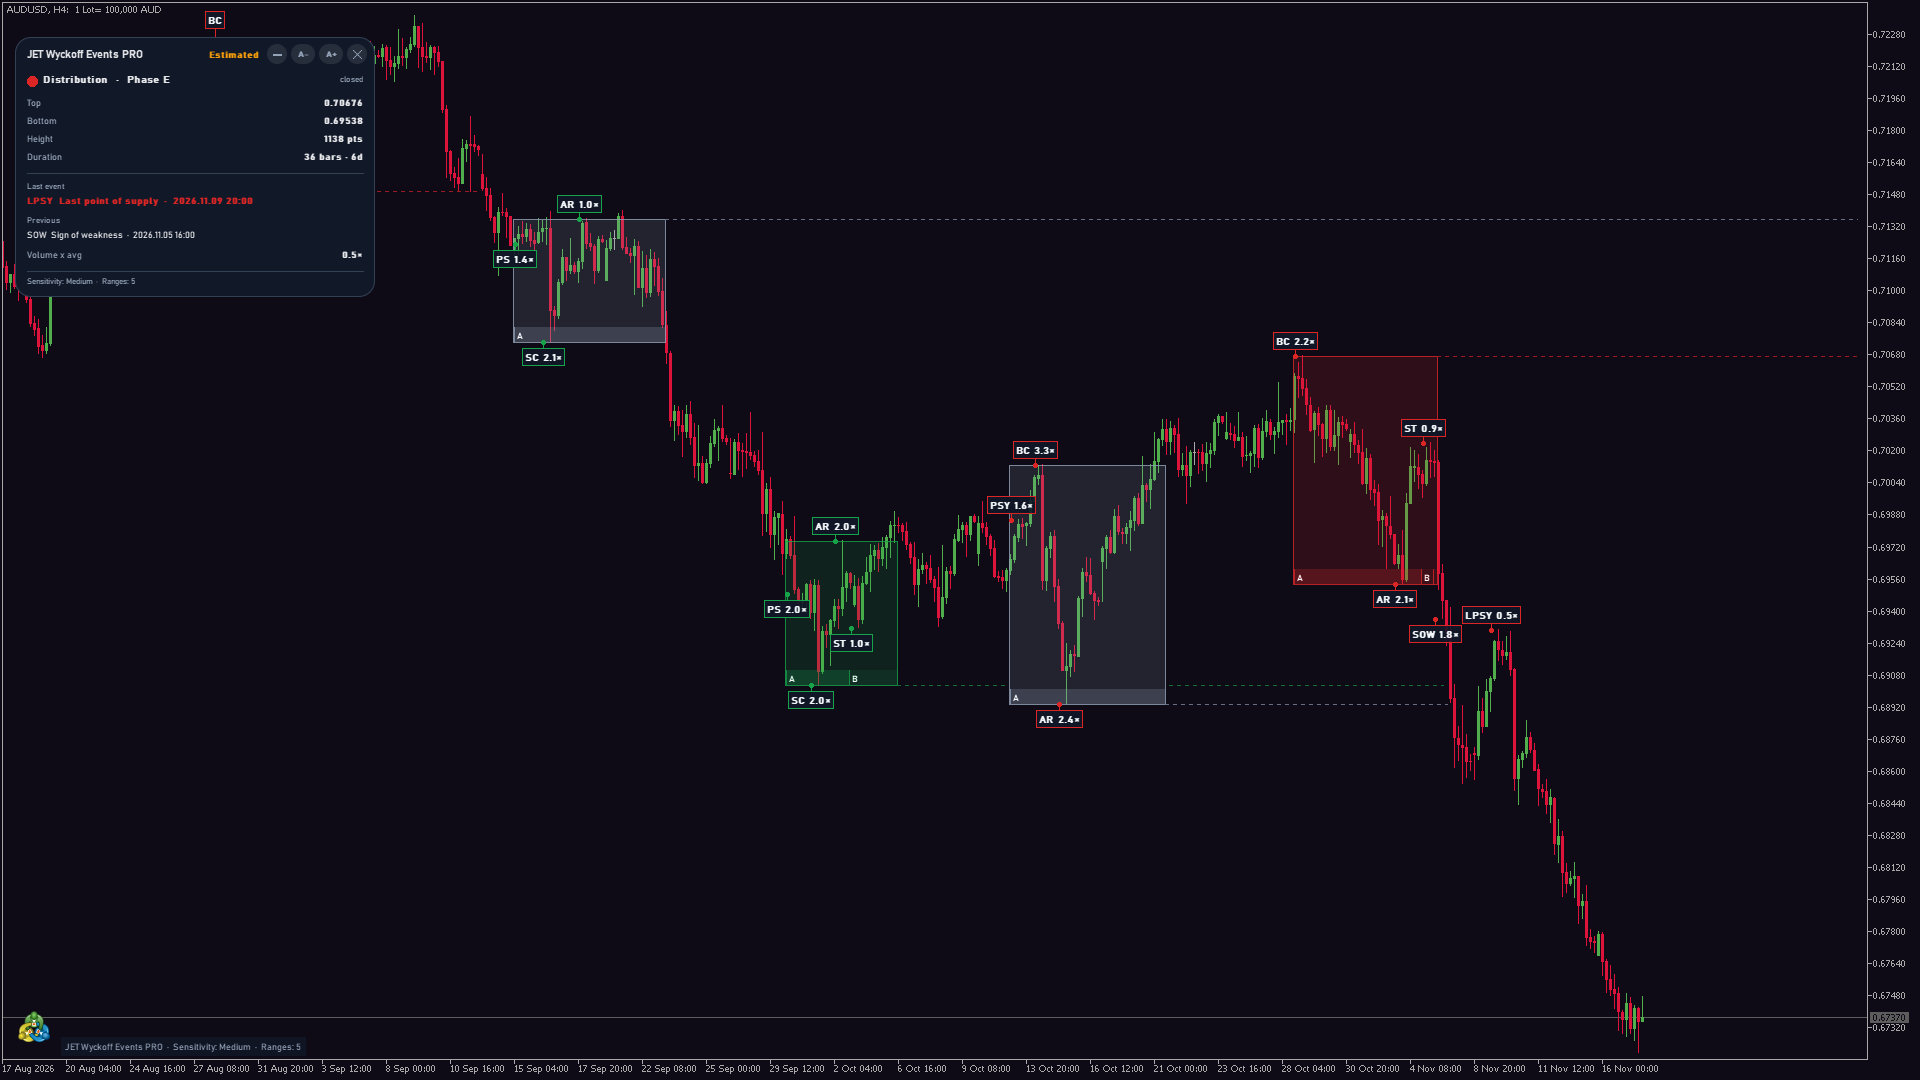
- Trading ranges: a box between support and resistance, green for accumulation, red for distribution and gray while the range is still to be defined. The border is dashed while the range is forming and solid once it is confirmed.
- Current and previous ranges: the range in progress and the previous ones (5 by default, up to 50).
- Events: a short label on the chart, with the full name in the tooltip.
- Relative volume: next to each label, the volume of the event bar compared with the average (e.g. "SC 3.2×"). It can be turned off.
- Provisional events: while an event is not confirmed, its label shows "?" with a dashed border (e.g. "Spring?"). It turns solid when confirmed, or disappears if it is not.
- Phases A to E: a thin band at the bottom of each range shows the letter of each phase and where it starts.
- Reference lines: the support and the resistance of each range, extended to the right until a close breaks them.
- No repainting of what is confirmed: confirmed events and closed ranges never change. Only provisional labels ("?") and the range in formation change until they are confirmed, and the phase only moves forward.
The events
Accumulation (green labels):
- PS preliminary support; SC selling climax; AR automatic reaction; ST secondary test;
- Spring; Test; SOS sign of strength; LPS last point of support; BU back-up to the creek.
Distribution (red labels):
- PSY preliminary supply; BC buying climax; AR automatic reaction; ST secondary test;
- UTAD upthrust after distribution; SOW sign of weakness; LPSY last point of supply.
The abbreviations are those of the method and stay the same in every language; the full names in the tooltip and in the panel follow the panel language. With the chart zoomed out, the labels shrink to the abbreviation. Hover over a label to see the full name, the time and the relative volume.

Real or estimated volume
- Real: where the broker sends real volume (futures and stocks of any exchange, e.g. B3, CME and others), the indicator uses it.
- Estimated: forex, CFDs and metals have no traded volume on MetaTrader 5; the indicator uses the tick volume (the number of price changes).
- The mode is always visible at the top of the panel (Real or Estimated) and is also available to Experts (buffer 7).
How to add it to the chart
- Open the Navigator (Ctrl+N) and find JET Wyckoff Events PRO under Indicators > Market.
- Drag it to the price chart (or double-click it), adjust the Inputs tab if you wish and click OK.
- It works on any symbol, on timeframes from M1 to D1.
- While there are not enough bars, the indicator shows "Waiting for enough bars". If no range has formed yet in the bars analysed, the panel shows "No range on the chart yet".
- To remove it, click [X] on the panel, or open the indicator list (Ctrl+I), select it and click Delete.
The panel
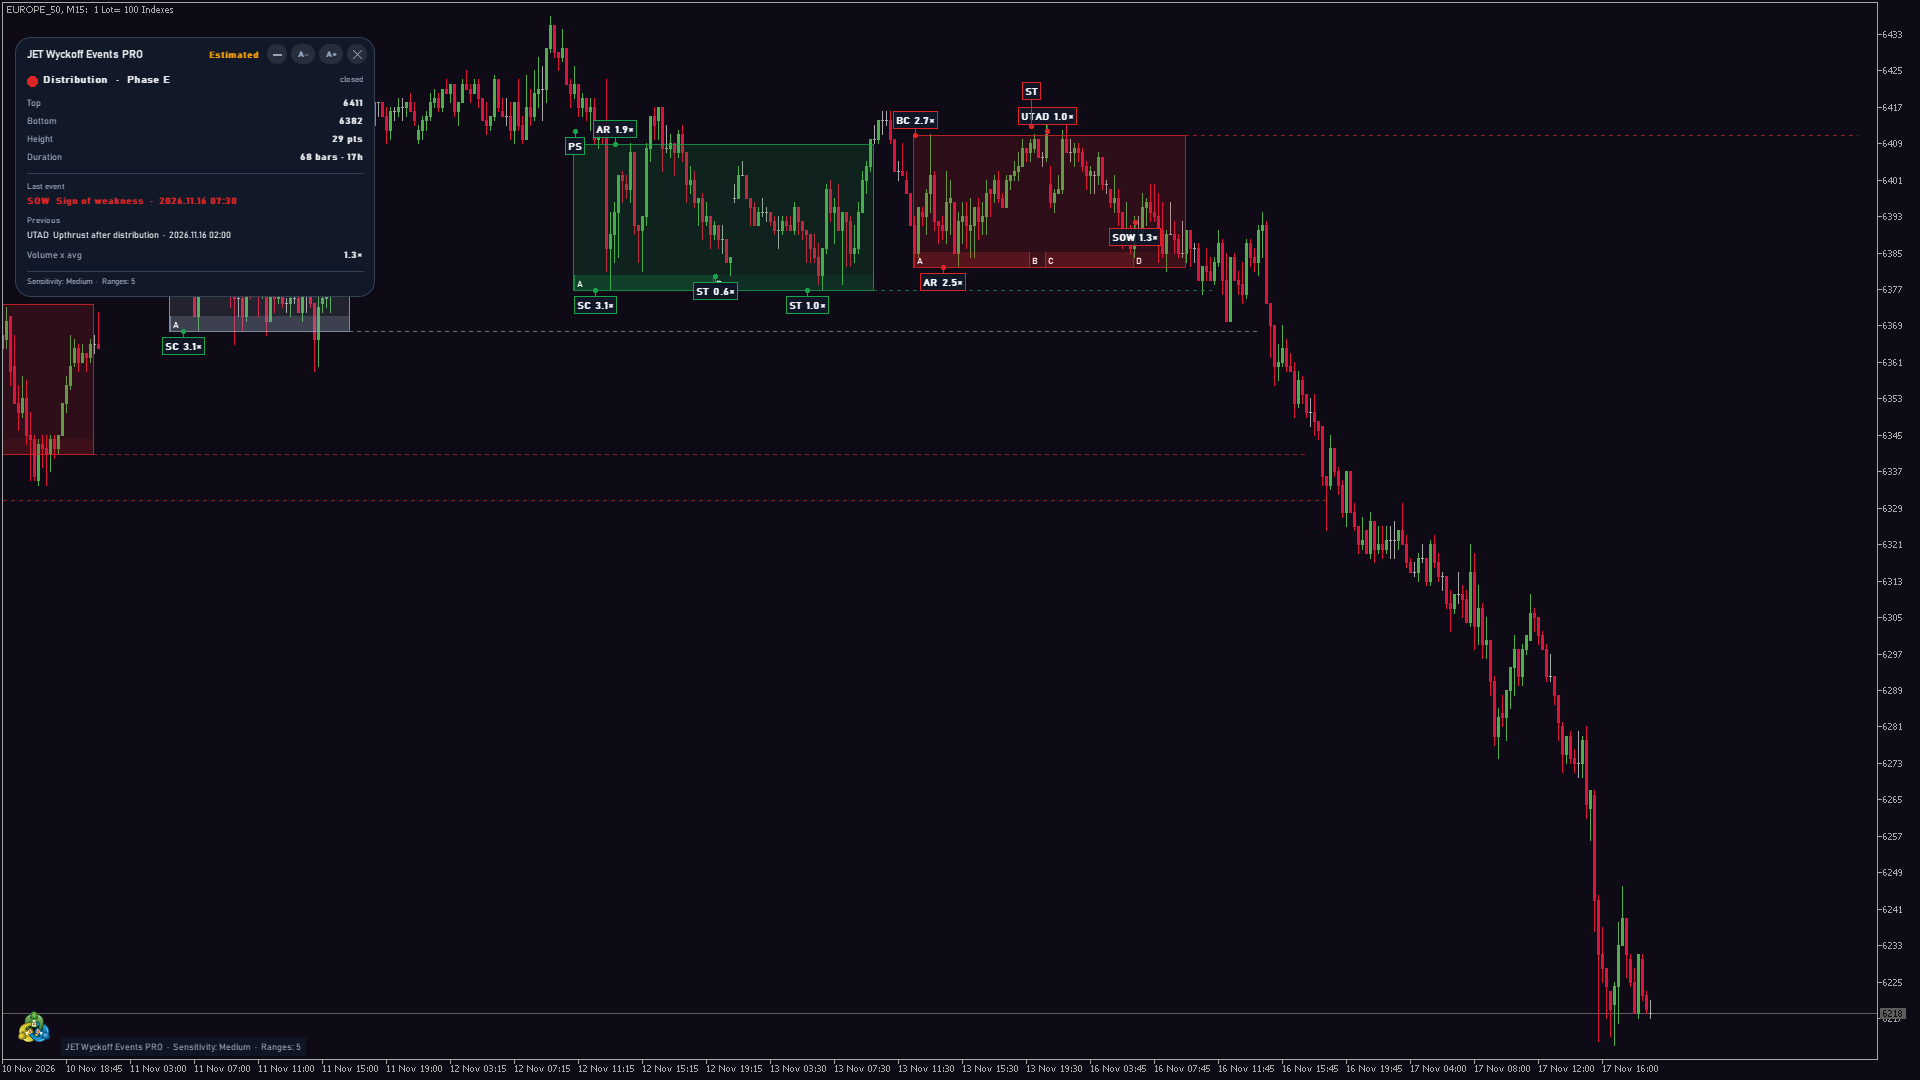
- Header: product name, data mode (Real or Estimated) and the buttons [–] (collapse), [A-] and [A+] (panel size, 60% to 200%) and [X] (remove the indicator). Drag the panel by its header to put it anywhere on the chart.
- Current range: type (Accumulation, Distribution or To be defined) and phase, with the status (forming or closed), then Top, Bottom, Height (in points) and Duration (in bars and time).
- Last event and Previous: abbreviation, full name and time of the two latest events of the range.
- Volume x avg: the volume of the last event compared with the average.
- Footer: sensitivity in use and number of ranges on the chart. The same line also appears at the bottom left of the chart.
- Light and dark themes (automatic from the chart background) and 11 languages. A label that would fall under the panel is not drawn: drag the panel aside to see it.
Inputs
Structure
- Sensitivity of tops and bottoms = Medium. Options: Low, Medium, High, Custom. Lower sensitivity keeps only the larger swings and gives fewer, longer ranges; higher sensitivity follows smaller swings.
- Custom: reversal (ATR multiples) = 2.0 and Custom: ATR period = 14. Used only with Sensitivity = Custom.
- Minimum range duration (bars) = 20. Shorter ranges are not kept.
- Maximum range height (ATR multiples) = 6.0.
- Bars of history (300-10000) = 2000.
Events
- Climax (SC/BC): volume from (x the average) = 2.0 and Climax (SC/BC): bar range from (x ATR) = 1.5.
- Spring/UTAD: maximum break (% of the range height) = 25 and Spring/UTAD: back inside within (bars) = 5.
- Test/ST: volume up to (x the climax volume) = 0.6.
- SOS/SOW: volume from (x the average) = 1.3.
- Show PS / PSY, Show SC / BC, Show AR, Show ST, Show Spring / UTAD, Show Test, Show SOS / SOW, Show LPS / LPSY, Show BU = true. Each event can be hidden from the chart.
Display
- Relative volume on the labels = true.
- Provisional events = true.
- Phases A-E = true.
- Reference lines = true.
- Previous ranges (0-50) = 5. Raise it to see the ranges further back in the history.
- Font size = 9.
Panel
- Show the panel = true.
- Theme = Automatic (chart background). Other options: Dark, Light.
- Panel size (%) = 100, also adjustable with [A-] and [A+].
- Language = Terminal language, or one of the 11 languages.
Colors
- Accumulation = green; Distribution = red; To be defined = gray; Label text = None (automatic, follows the chart background).
Alerts
Alerts fire only on confirmed events. Group Alerts (confirmed events only):
- Spring or UTAD = Popup + Sound. Message, e.g.: "Spring confirmed: 1.08250".
- SOS or SOW = Popup + Sound. Message, e.g.: "Sign of strength (SOS): 1.08710".
- Climax (SC or BC) = Off. Message, e.g.: "Selling climax (SC): 1.07940".
- Phase change = Off. Message, e.g.: "Phase C started: Accumulation".
- Range break = Off. Message, e.g.: "Range broken up: 1.09120".
- Modes: Off, Popup, Sound, Smartphone notification, Popup + Sound, Notification + Sound, Popup + Notification, Popup + Sound + Notification.
- Sound = alert (a sound of the terminal), used by all alerts. Also send e-mail = false; when true, each alert that is on also sends an e-mail.
- Each alert starts with the product name, the symbol and the timeframe. Push notifications and e-mail must be set up in Tools > Options (Notifications and Email tabs). Alert messages use the panel language.
Data for Experts (iCustom)
The indicator has 8 buffers with one value per bar, readable with iCustom and CopyBuffer. They are not drawn on the chart.
| Buffer | Content |
|---|---|
| 0 | Event confirmed on the close of this bar (code: 1 PS, 2 SC, 3 AR, 4 ST, 5 Spring, 6 Test, 7 SOS, 8 LPS, 9 BU; negative for distribution: -1 PSY, -2 BC, -3 AR, -4 ST, -5 UTAD, -7 SOW, -8 LPSY; 0 none) |
| 1 | Provisional event on this bar (same codes; 0 none) |
| 2 | Top of the active range (empty outside a range) |
| 3 | Bottom of the active range (empty outside a range) |
| 4 | Range type: +1 accumulation, -1 distribution, 0 to be defined |
| 5 | Phase: 1 A, 2 B, 3 C, 4 D, 5 E; 0 no range |
| 6 | Volume of the event bar / average |
| 7 | Data mode: 1 real, 2 estimated |
- Each value is what was known at the close of the bar and never changes afterwards.
- A confirmed event can lie a few bars before the bar where buffer 0 reports it. If two events are confirmed on the same bar, the second one is reported on the next bar.
- On the bar in progress (index 0), buffers 1 to 5 repeat the last closed bar and change when it closes. Read closed bars (index 1 and older) for stable values.
- Empty values are EMPTY_VALUE.
- The buffers follow the inputs of the indicator (sensitivity, event rules); iCustom without inputs uses the defaults.
- Example: handle = iCustom(_Symbol, PERIOD_CURRENT, "Market\\JET Wyckoff Events PRO"); then read buffer 0 of bar 1 with CopyBuffer: 5 means that a Spring was confirmed on the close of the last bar, -5 a UTAD.
- In the Data Window (Ctrl+D) the values appear as Event confirmed (code), Provisional event (code), Range top and so on.
Free or PRO?
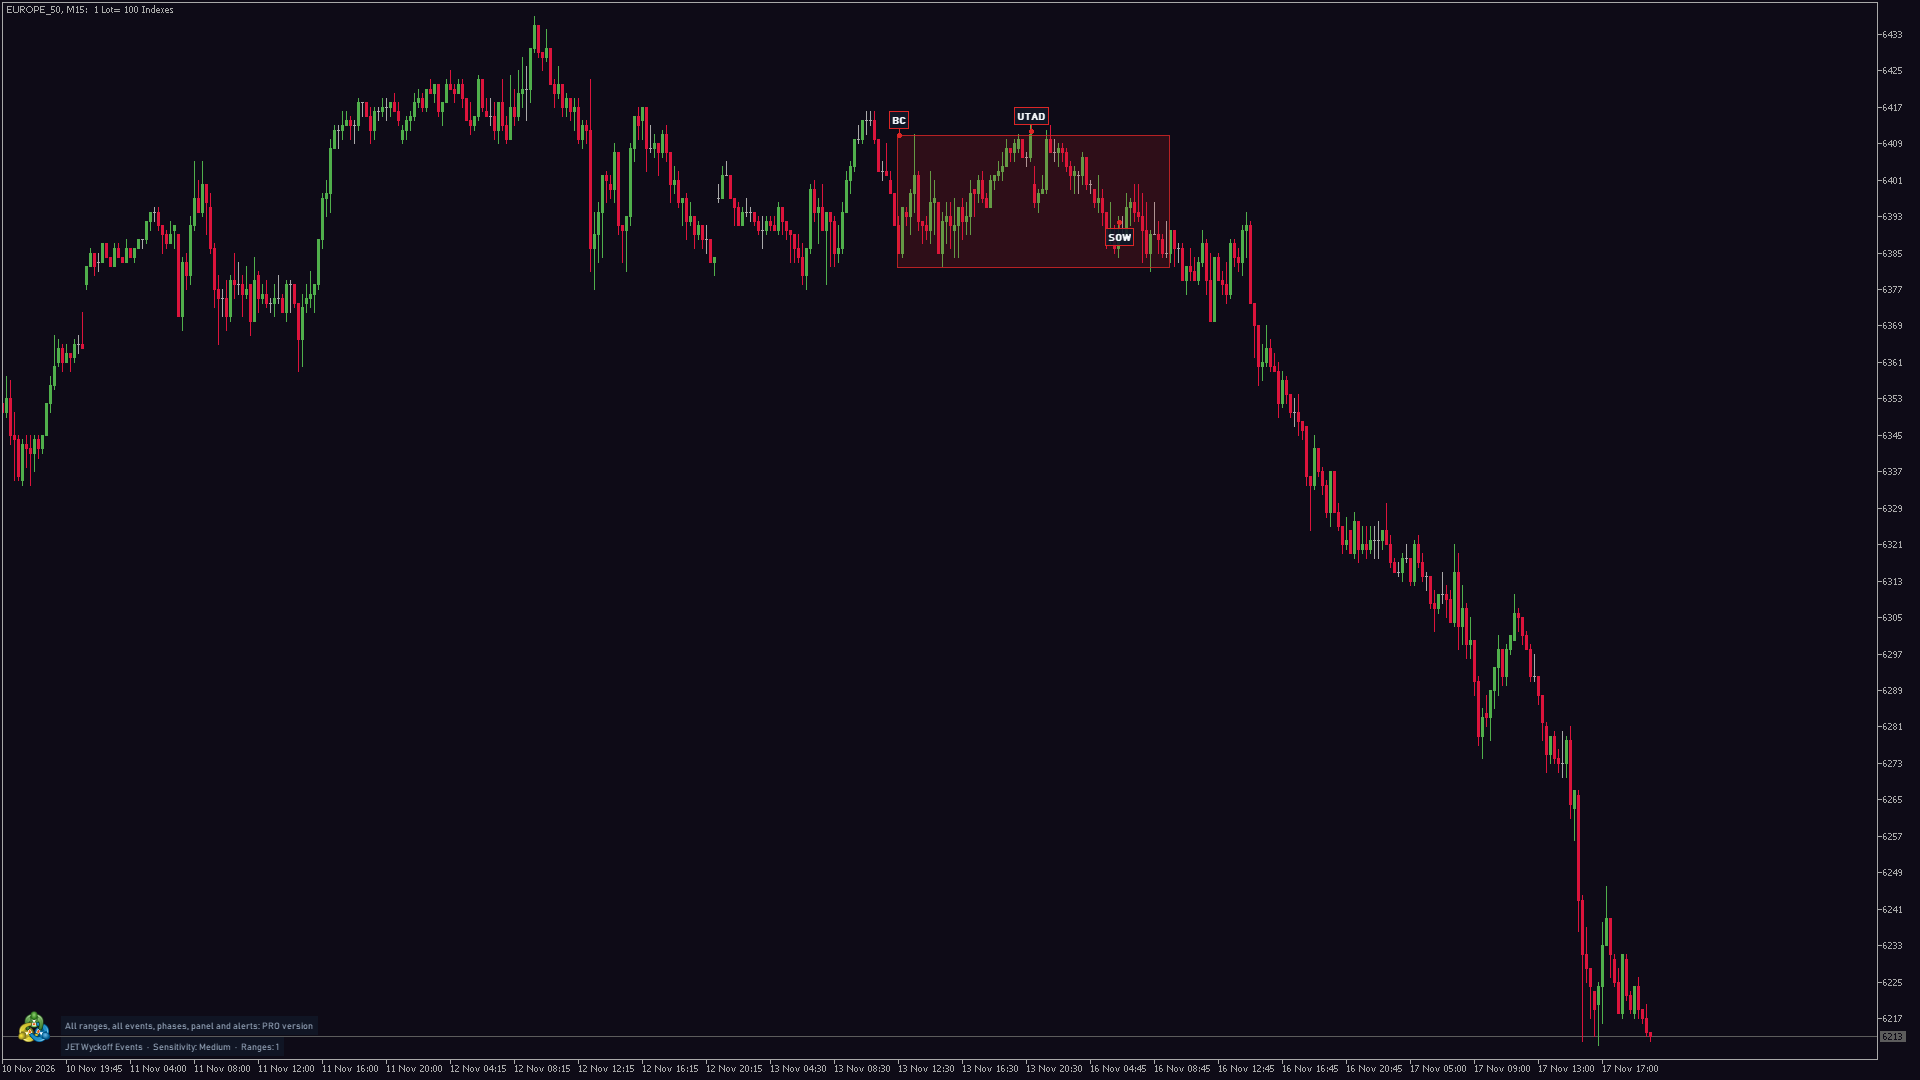
The free JET Wyckoff Events shows only the most recent trading range (in progress or the last one closed) with its three main events on each side: SC, Spring and SOS in accumulation; BC, UTAD and SOW in distribution. The settings are fixed (Medium sensitivity, 2,000 bars) and the only input is the language. JET Wyckoff Events PRO adds:
- every range of the history (the current one plus up to 50 previous ones) and every event: PS, AR, ST, Test, LPS, BU, PSY and LPSY as well;
- phases A to E, reference lines, provisional events ("?") and relative volume on the labels;
- the panel with the current range, the last events and the data mode;
- configurable sensitivity and event rules, colors and font;
- alerts and the 8 buffers for Experts.
Tips and frequent questions
- Too many short ranges? Use Sensitivity = Low or raise Minimum range duration. Too few? Use Sensitivity = High.
- Ranges disappear when I scroll back: only the current range and the previous ones set in Previous ranges are drawn (5 by default). Raise it up to 50 to see more history.
- Why does a range start with a climax? In the indicator a range always starts with a climax (SC or BC); a consolidation without a climax does not become a range.
- Distribution has no Test or BU: the retest after a breakdown is labeled LPSY.
- A provisional label disappeared: the event was not confirmed. Turn off Provisional events if you prefer to see only confirmed events.
- After changing the timeframe or loading more history, the indicator recalculates the bars analysed; the oldest ranges at the start of the window may differ. In real time and in the Strategy Tester confirmed events do not change.
- Estimated mode: on forex, CFDs and metals the volume is the tick volume. The relative volume on the labels compares bars of the same symbol, so it remains useful for comparing effort between bars.
- Weis waves: JET Wyckoff Events PRO shows the structure; JET Weis Waves PRO, from the same school, shows the volume of each wave. They can be used together on the same chart.
- Reading the marks: the labels show where the events of the method happened according to the rules of the inputs. They describe what already happened; they do not forecast the next move.
Download
- JET Wyckoff Events PRO: all ranges, events and phases, panel, alerts and data for Experts.
- JET Wyckoff Events: free version, with the most recent range and its main events, without panel, alerts and data for Experts.
Questions and suggestions: send me a private message through my MQL5 profile.
Trading involves risk of loss. The indicator marks on the chart the events of the Wyckoff method according to configurable rules: it shows what happened, it does not forecast prices and it does not guarantee results. In estimated mode, the volume is the tick volume.





