

JET Ultra SMC Signals is a paid indicator for MetaTrader 5 that draws the Smart Money Concepts on the price chart (market structure, order blocks, fair value gaps, liquidity and higher timeframe zones) and adds entry signals built from a liquidity sweep, a change of character (CHoCH) and a retest. Each signal comes with a confluence score from 0 to 100 and with the entry, the stop and two targets drawn on the chart. It has a panel, alerts and data for Experts. On the chart and in the panel its name is JET SMC Ultra. Everything is confirmed on closed bars. It is an indicator only: it never opens, closes or changes orders.
What it shows
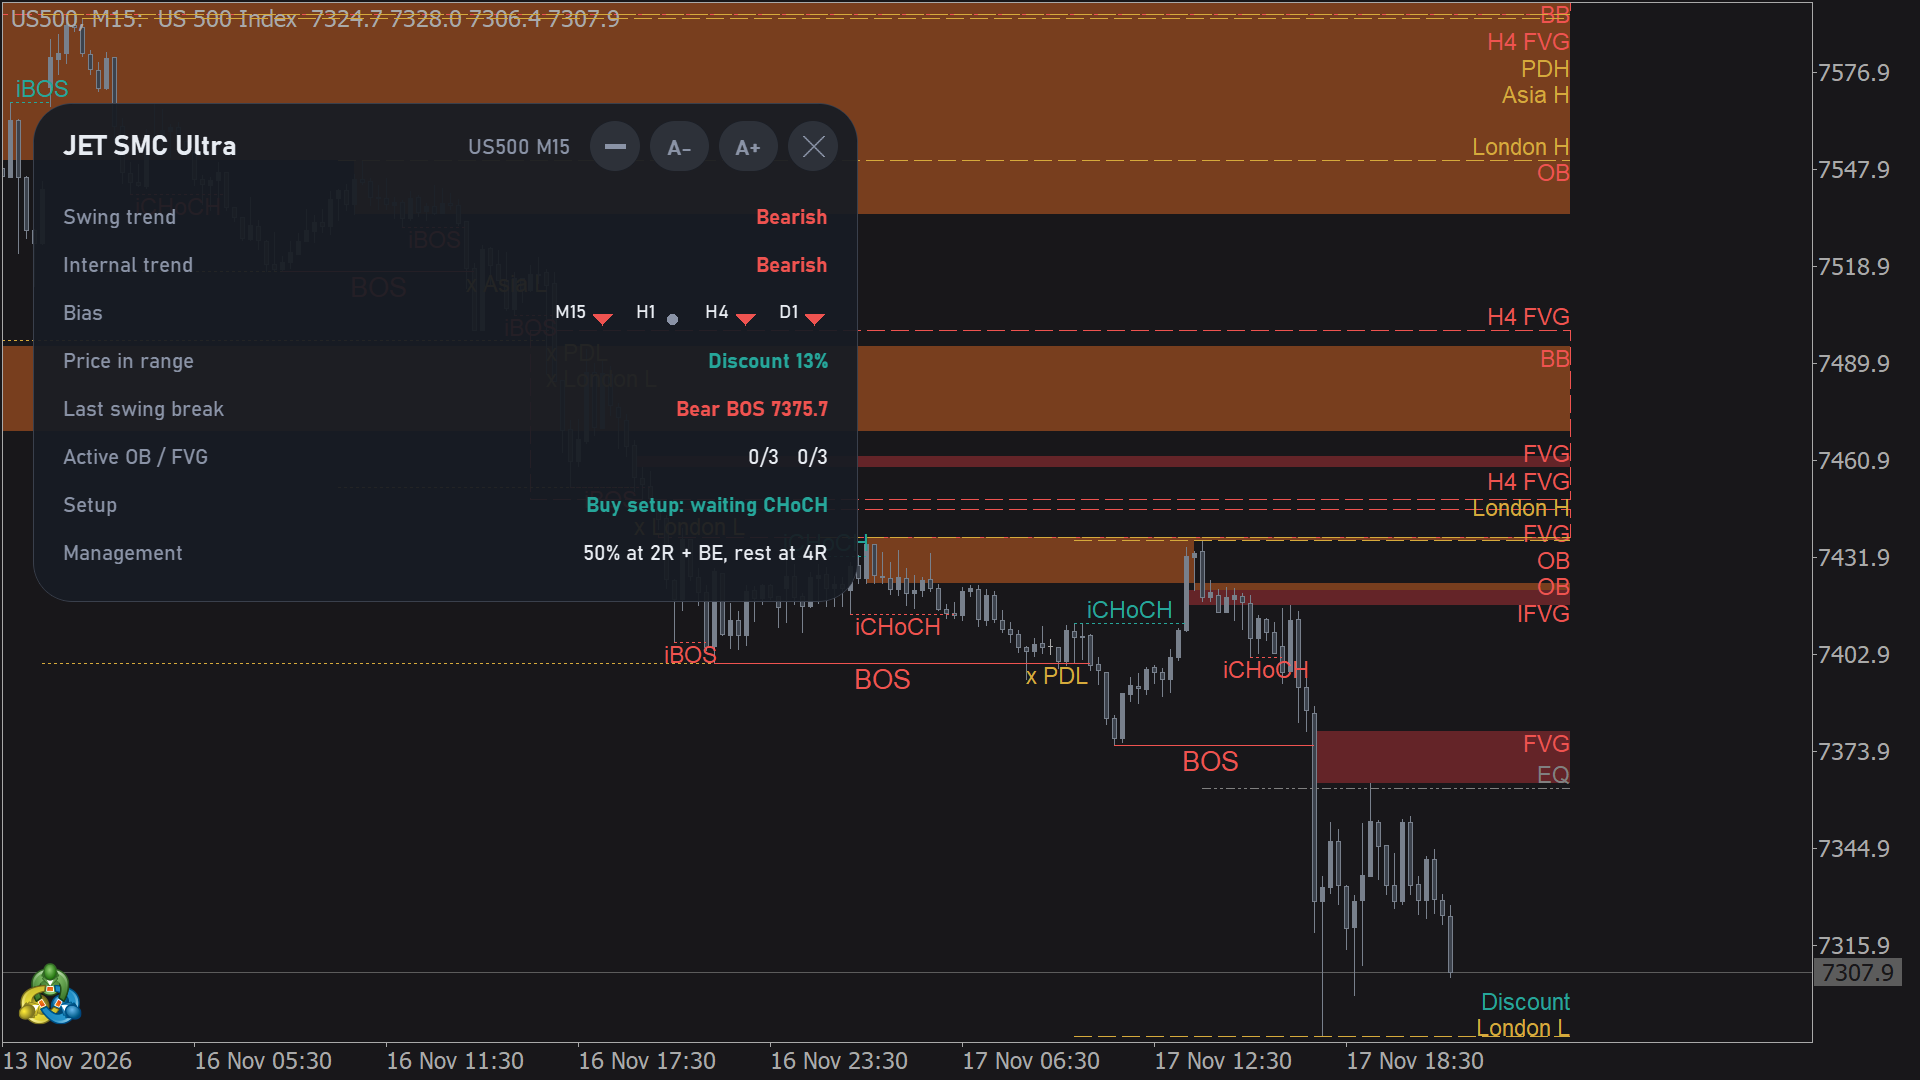
- Market structure: swing BOS and CHoCH (larger labels) and internal iBOS and iCHoCH (smaller labels), each with the level that was broken.
- Zones: order blocks (OB), breaker blocks (BB, broken order blocks), fair value gaps (FVG) and inversion FVGs (IFVG), extended to the right while they are active.
- Liquidity: equal highs and lows (EQH / EQL), previous day and week highs and lows (PDH / PDL, PWH / PWL), Asia and London session highs and lows (Asia H / L, London H / L) and, optionally, swing highs and lows. A level that was swept gets an "x" before its name (e.g. "x PDH").
- Premium / discount: the equilibrium (EQ) of the swing range, with Premium above and Discount below.
- Higher timeframe: the order blocks and FVGs of the higher timeframe, labeled with the timeframe (e.g. "D1 OB", "D1 FVG").
- Entry signals: an arrow (green up for buy, red down for sell), a label with the direction and the score (e.g. "SELL 80") and the lines of the entry, the stop and targets 1 and 2.
- No repainting: structure, zones and signals are confirmed on the close of the bar and are not redrawn afterwards.

How to add it to the chart
- Open the Navigator (Ctrl+N) and find JET Ultra SMC Signals under Indicators > Market.
- Drag it to the price chart (or double-click it), adjust the Inputs tab if you wish and click OK.
- It works on forex, metals, indices, futures and stocks, on any timeframe. Recommended timeframes: H1 and M15.
- To remove it, click [X] on the panel, or open the indicator list (Ctrl+I), select it and click Delete.
The entry signals
- Sequence: price sweeps a liquidity level, a CHoCH follows within the number of bars set in the inputs (20 by default) and price comes back to the zone within another 20 bars (by default). The panel shows at which step the current setup is.
- Entry model: limit order at the origin zone (default), limit order in the OTE of the move, or close after a retest of the newest zone.
- Stop: beyond the extreme of the sweep. Signals with a stop too wide for the input Skip signals with a stop wider than are not drawn.
- Targets: a partial target (2R by default, 50% of the position, then stop to break-even) and a final target (4R by default). R is the distance between the entry and the stop. These are inputs: change them to your own management.
- Score: from 0 to 100, it sums the confluences present at the signal. Hover over the arrow to see the score and the confluences that formed it. With Minimum confluence score you hide the signals below a value.
- Filters: signal hours (any time, ICT killzones or custom hours) and, optionally, only in the direction of the higher timeframe.
- On the chart, the entry line is gray and solid, the stop line red and dotted, and the target lines green and dotted. The lines end when the signal ends.

The panel
- Header: JET SMC Ultra, the symbol and the timeframe, and the buttons [–] (collapse), [A-] and [A+] (panel size, 60% to 200%) and [X] (remove the indicator). Drag the panel by its header to put it anywhere on the chart.
- Swing trend and Internal trend: Bullish or Bearish.
- Bias: the direction of the structure on the chart timeframe and on higher timeframes (e.g. H1, H4, D1): green triangle up, red triangle down, gray dot when there is no direction.
- Price in range: Premium or Discount with the position in the swing range (%), or Above range / Below range.
- Last swing break: Bull or Bear, BOS or CHoCH, and the price.
- Active OB / FVG: the number of active bullish / bearish order blocks and FVGs.
- Setup: "Waiting for a sweep", or "Buy setup" / "Sell setup" with "waiting CHoCH" or "waiting retest".
- Management: how the targets are set, e.g. "50% at 2R + BE, rest at 4R".
- At the bottom, the latest alerts with their time (up to 5).
- The panel texts are in English; its colors follow the chart background (light or dark).
Statistics on the chart (Show signal statistics)
With the input Show signal statistics and results (R) on the chart = true (default), the panel shows three more rows and each closed signal shows its result in R next to its label:
- Zones held (history): for order blocks and FVGs, the share of zones in the bars analysed that held when price came back to them.
- Signals (history): the number of signals in the bars analysed, with the share that reached the partial target, the final target or the stop.
- Average / total R: the average and the sum, in R, of the signals in the bars analysed.
These rows only describe the history of the current chart (symbol, timeframe, bars analysed and the inputs in use). They change with any of these and do not guarantee future results. Set the input to false to hide them; the screenshots in this manual were taken with it off.

Inputs
MARKET STRUCTURE
- Internal structure strength (bars each side) = 3 and Swing structure strength (bars each side) = 10. Higher values keep only larger swings.
- Swing BOS / CHoCH = true; Internal BOS / CHoCH = true.
- Structure breaks shown (each scope) = 10.
- Bullish color = teal; Bearish color = red.
ORDER BLOCKS AND FAIR VALUE GAPS
- Order blocks = true; Order blocks also from internal breaks = false; Order block on the candle body = false (on the wick).
- Breaker blocks (broken order blocks) = true.
- Fair value gaps = true; Inversion FVGs (closed-through gaps) = true.
- Minimum FVG size (x ATR 14) = 0.15.
- Zone ends at = Full fill / close through. Other options: First touch; 50% (consequent encroachment).
- Active zones per type and side = 3.
- Colors of the bullish and bearish order blocks and FVGs.
LIQUIDITY
- Equal highs / lows = true; Equal highs / lows tolerance (x ATR 14) = 0.1.
- Swing highs / lows (buy-side / sell-side liquidity) = false.
- Previous day and week highs / lows = true.
- Asia and London session highs / lows = Auto (off on B3 symbols). Other options: On, Off. The session levels are drawn on timeframes up to H1.
- Mark liquidity sweeps = true; Active levels per type and side = 3; Liquidity color = gold.
PREMIUM / DISCOUNT
- Equilibrium of the swing range = true.
HIGHER TIMEFRAME
- Higher timeframe for bias and zones (current = auto) = current. In auto, M1 uses M15, M5 uses H1, M15 and M30 use H4, H1 and H4 use D1, and higher timeframes use W1.
- Show higher timeframe order blocks and FVGs = true.
SESSIONS
- Broker time zone = Auto (live) / GMT+2/+3 in tester. Other options: GMT+2 / GMT+3 (New York close brokers); Fixed GMT offset.
- Broker GMT offset (fixed mode and tester) = 2.
SIGNALS (sweep, CHoCH, retest)
- Show entry signals = true.
- Minimum confluence score (0-100) = 0 (all signals).
- CHoCH must come within (bars after the sweep) = 20; Retest must come within (bars after the CHoCH) = 20.
- Entry model = Limit order at the origin zone (closest to the sweep). Other options: Limit order in the OTE of the move (fib level below); Close after a retest of the newest zone.
- OTE entry level (retracement of the move) = 0.705. Used with the OTE entry model.
- Equal highs / lows sweeps also arm setups = false.
- Stop beyond the sweep (x ATR 14) = 0.1; Skip signals with a stop wider than (x ATR 14) = 4.0.
- Minimum move away from the entry zone before the first test (x ATR 14, 0 = off) = 2.0.
- Partial target (R) = 2.0; Partial size (% of the position, 0 = no partial) = 50; Stop to break-even after the partial = true; Final target (R) = 4.0.
- Signal hours = Any time. Other options: ICT killzones (London, NY AM, NY PM); Custom hours (server time), with Custom hours from = 09:00 and to = 17:00.
- Only in the direction of the higher timeframe = false.
- Signals drawn on the chart = 40.
- Show signal statistics and results (R) on the chart = true (see the section above).
HISTORY AND PANEL
- Bars analysed = 3000.
- Active zones and levels extend right (bars) = 15.
- Show panel = true; Panel size (%) = 100.
Alerts
Group ALERTS:
- Entry signal = Sound. The message gives the direction, the score, the stop and target 1.
- Swing BOS / CHoCH = Off. Message, e.g.: "Bullish CHoCH at 1.08520".
- Liquidity sweep = Off. Message, e.g.: "PDH swept at 1.09140".
- Price enters an order block or FVG = Off.
- Modes: Off, Popup, Sound, Smartphone notification, Popup + Sound, Notification + Sound, Popup + Notification, Popup + Sound + Notification.
- Sound = alert2 (a sound of the terminal). Also send e-mail = false; when true, each alert that is on also sends an e-mail.
- Each alert starts with the indicator name, the symbol and the timeframe, and also appears at the bottom of the panel. Push notifications and e-mail must be set up in Tools > Options (Notifications and Email tabs).
Data for Experts (iCustom)
The indicator has 9 buffers with one value per bar, readable with iCustom and CopyBuffer. They are not drawn on the chart.
| Buffer | Content |
|---|---|
| 0 | Swing trend: +1 bullish, -1 bearish |
| 1 | Internal trend: +1 bullish, -1 bearish |
| 2 | Structure event on this bar: ±1 swing BOS, ±2 swing CHoCH, ±3 internal BOS, ±4 internal CHoCH (positive bullish, negative bearish; 0 none) |
| 3 | Signal on this bar: +1 buy, -1 sell, 0 none |
| 4 | Entry of the signal |
| 5 | Stop of the signal |
| 6 | Target 1 of the signal |
| 7 | Target 2 of the signal |
| 8 | Score of the signal (0-100) |
- Values are written on closed bars and do not change afterwards. Read bar 1 (the last closed bar) or older.
- Buffers 3 to 8 are 0 on bars without a signal.
- The buffers follow the inputs of the indicator; iCustom without inputs uses the defaults.
- Example: handle = iCustom(_Symbol, PERIOD_CURRENT, "Market\\JET Ultra SMC Signals"); then read buffer 3 of bar 1 with CopyBuffer: +1 or -1 means that a signal formed on the last closed bar, and buffers 4 to 8 give its entry, stop, targets and score.
Ultra or SMC Structure and Liquidity PRO?
SMC Structure and Liquidity PRO has the same structure, zones, liquidity, premium / discount, higher timeframe zones, panel and alerts. JET Ultra SMC Signals adds:
- the entry signals (sweep, CHoCH and retest) with the entry, stop and targets drawn on the chart;
- the confluence score and the signal filters (score, hours, higher timeframe direction);
- the setup status, the management and the optional statistics rows in the panel;
- the entry signal alert and the signal buffers (3 to 8) for Experts.
Tips and frequent questions
- Too many signals? Raise Minimum confluence score, turn on Only in the direction of the higher timeframe or limit Signal hours. Too few? Lower the score or turn on Equal highs / lows sweeps also arm setups.
- Chart too busy? Turn off Internal BOS / CHoCH, lower Active zones per type and side and Active levels per type and side, or turn off the session levels.
- Session levels missing: they are drawn only on timeframes up to H1, and in Auto they are off on B3 symbols. If the Asia and London levels look shifted, set the Broker time zone.
- Signals on the history: they appear on the bars analysed (Bars analysed = 3000) and up to Signals drawn on the chart = 40.
- Statistics rows: they describe the history of the current chart only; a different symbol, timeframe or input changes them. They do not guarantee future results.
- Reading the signals: a signal marks on the chart that the sequence of sweep, CHoCH and retest happened, with the levels of the inputs. It is not a recommendation; decide your entries and risk yourself.

Download
- JET Ultra SMC Signals: structure, zones and liquidity, entry signals with score, stop and targets, panel, alerts and data for Experts.
- SMC Structure and Liquidity PRO: the same structure, zones, liquidity and alerts, without the entry signals.
Questions and suggestions: send me a private message through my MQL5 profile.
Trading involves risk of loss. Signals and statistics are measured on past bars of the chart; past results do not guarantee future results. The indicator shows market information; it does not forecast prices or guarantee results.





