Will Your EA Pass a Prop Firm Challenge? Measuring Pass Rates Under Different Rules in the Strategy Tester

Introduction
A Strategy Tester report answers the question "how did this strategy perform on this history?". It gives net profit, profit factor, maximum drawdown and a smooth equity curve. A prop firm challenge asks a different question: "will this strategy reach the profit target before it breaks a rule?". The answer is pass or fail, and it depends on details the standard report does not show.
- A 7% maximum drawdown in the report says nothing about whether equity ever fell 5% within a single day.
- A backtest that made 25% in a year may never have made 10% inside any 30-day window.
- A static drawdown floor and a trailing one can give opposite results for exactly the same trades.
- Above all, one backtest is one path. The same strategy with the same edge, trading the same kind of days in a different order, can pass or fail.
In this article we add a challenge report to the Strategy Tester. A small class records the equity path during the test. At the end of the run it checks the path against several rule sets and then uses bootstrap resampling to estimate how often the strategy would pass if the days had come in a different order. The estimate is returned from OnTester(), so the optimiser can search for parameters that pass most often, not just the ones that make the most money.
What a challenge actually measures
Most challenges can be described by five numbers:
| Rule | Typical value | How it is checked |
|---|---|---|
| Daily loss limit | 4-5% of the day-start equity | Lowest equity of the day versus the day start |
| Maximum drawdown | 6-10% of the initial balance | Lowest equity versus a static or trailing floor |
| Drawdown type | static or trailing | Trailing floors move up with the highest equity |
| Profit target | 8-10% | Equity at or above the target |
| Time limit | 30 days or unlimited | Number of trading days used |
Two of these rules need intraday information. The daily limit and the drawdown are checked against the lowest equity, not against the closing equity. A day that dipped 5.2% and then recovered to -1% is still a breach. So for every day we need two values: the closing equity and the lowest equity seen during the day.
We keep these rules in a structure:
struct SChallengeRules
  {
   string            name;
   double            daily_pct;     // daily loss limit, % of the day-start equity
   double            dd_pct;        // maximum drawdown, % of initial or of the peak
   bool              trailing;      // true = drawdown floor follows the highest close
   double            target_pct;    // profit target, % of initial
   int               max_days;      // trading days allowed (0 = unlimited)
  };
In our model a trailing floor sits a fixed amount (the drawdown percentage of the initial balance) below the highest daily close. This is the most common trailing definition; firms that trail on intraday equity or stop trailing at the initial balance can be modelled by changing two lines in the check function shown below.
Recording the equity path in the tester
The CPropChallengeStats class records one entry per day. On the first tick of a new day it appends a new element; on every other tick it updates the day's close and, if equity is lower than before, the day's low:
void CPropChallengeStats::OnTick(void)
  {
   double equity=AccountInfoDouble(ACCOUNT_EQUITY);
   long   day   =(long)(TimeCurrent()/86400);
   if(day!=m_day)
     {
      int n=ArraySize(m_close);
      ArrayResize(m_close,n+1,512);
      ArrayResize(m_low,n+1,512);
      m_close[n]=equity;
      m_low[n]  =equity;
      m_day=day;
      return;
     }
   int last=ArraySize(m_close)-1;
   m_close[last]=equity;
   if(equity<m_low[last])
      m_low[last]=equity;
  }
The day is taken from the server time of the tick, so the daily boundary matches the broker's midnight. The low is only as precise as the tick data: use "Every tick based on real ticks" for a realistic intraday low. In "Open prices only" mode the lows will be too optimistic and the estimates will be too.
The reserve size of 512 in ArrayResize() avoids reallocating the arrays every day, which keeps the overhead per tick negligible.
Replaying the path against the rules
The core of the class is a function that walks an equity path day by day and stops at the first event: a daily breach, a drawdown breach, the target, or the end of the allowed time.
ENUM_CHALLENGE_OUTCOME CPropChallengeStats::Check(const double &close[],const double &low[],const int days,
                                                  const SChallengeRules &rules,int &days_used) const
  {
   double start =m_initial;   // equity at the start of the current day
   double peak  =m_initial;
   double target=m_initial*(1.0+rules.target_pct/100.0);
   for(int d=0; d<days; d++)
     {
      days_used=d+1;
      double daily_floor=start*(1.0-rules.daily_pct/100.0);
      double dd_base    =rules.trailing ? peak : m_initial;
      double dd_floor   =dd_base-m_initial*rules.dd_pct/100.0;
      if(low[d]<=daily_floor)
         return(CH_DAILY_BREACH);
      if(low[d]<=dd_floor)
         return(CH_DD_BREACH);
      if(close[d]>=target)
         return(CH_PASSED);
      if(rules.max_days>0 && days_used>=rules.max_days)
         return(CH_TIMEOUT);
      start=close[d];
      if(close[d]>peak)
         peak=close[d];
     }
   return(CH_TIMEOUT);
  }
The order of the checks is deliberate. Breaches are tested before the target, because a day that first dipped through a floor and then closed above the target is a failure on every firm we know of. The previous day's close becomes the next day's start, which corresponds to the "day-start equity" definition of the daily limit.
Applying this function to the recorded path gives the historical outcome: what would have happened if the challenge had started on the first day of the test.
From one path to many: bootstrap resampling
The historical outcome is a single coin toss. If the first week of the test happened to be strong, the challenge passes; if the strategy's two worst days came early, it fails. To separate the strategy from the luck of the calendar we use a bootstrap.
The idea is simple. Each recorded day is turned into two relative numbers: the change of the close from the previous close, and the dip of the low below the previous close. We then build a new path by drawing days at random, with replacement, from this collection, and check the new path against the rules. Repeating this a few thousand times gives a distribution of outcomes, and the share of passed paths is the estimated pass rate.
double prev=m_initial;
for(int i=0; i<n; i++)
  {
   ret[i]=m_close[i]/prev-1.0;   // day's close change
   dip[i]=m_low[i]/prev-1.0;     // day's worst point
   prev=m_close[i];
  }
...
for(int s=0; s<simulations; s++)
  {
   double eq=m_initial;
   for(int d=0; d<len; d++)
     {
      int k=(int)(Random()*n);
      low[d]  =eq*(1.0+dip[k]);
      eq      =eq*(1.0+ret[k]);
      close[d]=eq;
     }
   if(Check(close,low,len,rules,used)==CH_PASSED)
      passed++;
  }
return(100.0*passed/simulations);
Keeping the close change and the dip of a day together is important: a day's low and its close are not independent, and splitting them would create unrealistic days. The random generator is a simple linear congruential generator with a fixed seed, so the same test always produces the same estimate and optimisation passes can be compared fairly.
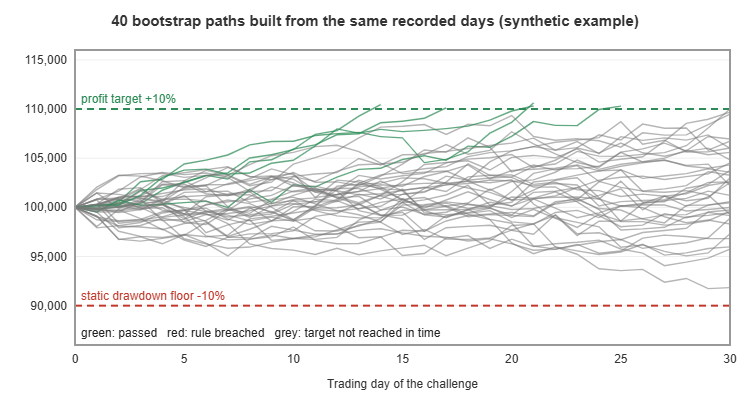
Figure 1 shows forty such paths built from one set of recorded days. The paths share the same daily statistics, yet some reach the target in two weeks, some never do, and a few touch a floor.
The report and the optimisation criterion
The Report() method prints one line per rule set to the tester journal: the historical outcome, the number of days it took, and the bootstrap pass rate. The attached example EA defines three rule sets in OnTester() and returns the pass rate of the first one:
double OnTester()
  {
   SChallengeRules rules[3];
   rules[0].name="5% daily / 10% static";    rules[0].daily_pct=5.0; rules[0].dd_pct=10.0;
   rules[0].trailing=false; rules[0].target_pct=10.0; rules[0].max_days=InpMaxDays;
   rules[1].name="5% daily / 10% trailing";  rules[1].daily_pct=5.0; rules[1].dd_pct=10.0;
   rules[1].trailing=true;  rules[1].target_pct=10.0; rules[1].max_days=InpMaxDays;
   rules[2].name="4% daily / 6% trailing";   rules[2].daily_pct=4.0; rules[2].dd_pct=6.0;
   rules[2].trailing=true;  rules[2].target_pct=8.0;  rules[2].max_days=InpMaxDays;

   g_stats.Report(rules,InpSimulations);
//--- optimise for the chance of passing the first rule set
   return(g_stats.PassRate(rules[0],InpSimulations,12345));
  }
Select "Custom max" as the optimisation criterion and the genetic optimiser will look for the parameters with the highest pass rate. This often finds different parameters from those with the highest profit: settings that make 30% a year with deep losing streaks rank lower than settings that make 15% with shallow ones, because the challenge rewards consistency inside a short window.
Adding the class to your own EA takes three lines: g_stats.Init() in OnInit(), g_stats.OnTick() at the top of OnTick(), and the rule definitions with a call to Report() or PassRate() in OnTester().
Reading the results
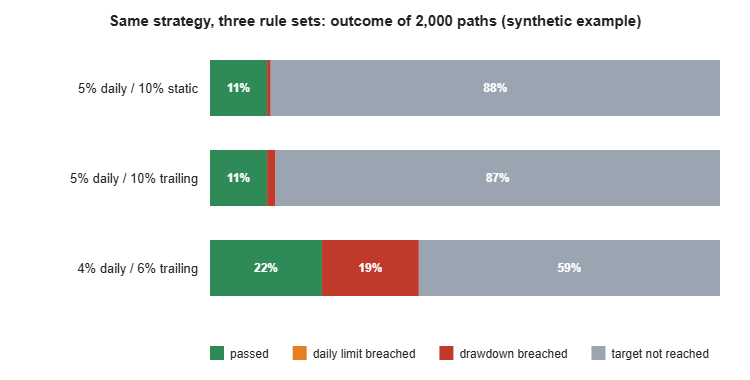
Figure 2 shows the outcome of 2,000 paths for each rule set, produced from a synthetic set of 120 recorded days of a modest strategy (average daily gain of about 0.16% with a daily standard deviation of about 0.9%). The numbers are an illustration of the method, not a statement about any real strategy.
Several lessons appear even in this small example:
- The time limit is the main obstacle. Under the first two rule sets almost nine paths in ten simply did not reach +10% within 30 trading days. The strategy is safe but too slow for this challenge. Increasing risk would raise the pass rate, but also the breach rate; the report lets you find the balance.
- Trailing versus static barely matters here (about 11% pass rate in both cases). With a 10% limit and a low-volatility strategy the floor is rarely approached. Run the same comparison on a more volatile strategy and the difference becomes large.
- Tighter limits with a lower target can be easier. The third rule set has stricter limits but an 8% target. Its pass rate doubles to about 22%, while drawdown breaches rise to about 19%. Whether a challenge is "hard" depends on how its rules fit a particular strategy.
How many simulations are enough?
A pass rate estimated from a finite number of paths has a sampling error. For an estimated rate p from N independent paths, the standard error is approximately:
standard error = sqrt( p * (1 - p) / N )
With a pass rate of 20% and 2,000 paths the standard error is about 0.9 percentage points, so the result can be read as "20% plus or minus 2%". With 500 paths it grows to about 1.8 points. The table gives a feel for the trade-off:
| Paths (N) | Standard error at p = 20% | Standard error at p = 50% |
|---|---|---|
| 500 | 1.8 points | 2.2 points |
| 2,000 | 0.9 points | 1.1 points |
| 10,000 | 0.4 points | 0.5 points |
For a single detailed report, 10,000 paths cost well under a second, because each path is only a few dozen multiplications per day. During a genetic optimisation, where OnTester() runs for every pass, 1,000 to 2,000 paths are a reasonable compromise. Because the generator uses a fixed seed, two passes with identical equity paths always receive identical scores, which keeps the optimiser from chasing random noise between passes.
Keep in mind that this is only the error from the simulation itself. The larger uncertainty comes from the recorded days: a different test period would give a different collection of days and a different estimate. Running the report on two or three separate periods is the simplest way to see how stable the estimate is.
Starting-day sensitivity: rolling historical windows
Before trusting the bootstrap, it is worth looking at a simpler and fully historical measure: what would have happened if the challenge had started on each day of the test in turn? This needs no random numbers at all. We run the same check on the recorded path starting from day 0, then from day 1, and so on, rebasing the equity so that every window starts from the same initial balance:
//--- share of historical start days from which the challenge would have passed
double RollingPassRate(const double &close[],const double &low[],const SChallengeRules &rules)
  {
   int n=ArraySize(close);
   int len=(rules.max_days>0) ? rules.max_days : n;
   if(n<=len)
      return(0.0);
   double c[],l[];
   ArrayResize(c,len);
   ArrayResize(l,len);
   int windows=0,passed=0;
   for(int start=1; start+len<=n; start++)
     {
      double base=close[start-1];           // equity before the window
      for(int d=0; d<len; d++)
        {
         c[d]=close[start+d]/base*100000.0;  // rebase every window to 100,000
         l[d]=low[start+d]/base*100000.0;
        }
      windows++;
      if(CheckPath(c,l,len,rules,100000.0)==CH_PASSED)
         passed++;
     }
   return(windows>0 ? 100.0*passed/windows : 0.0);
  }
Here CheckPath() stands for the same rule check shown earlier, with the initial balance passed as a parameter instead of taken from the class member. The rolling rate keeps the real order of the days, including losing streaks, which the simple bootstrap does not. If the rolling rate is much lower than the bootstrap rate, the strategy's losses cluster in time, and the bootstrap is too optimistic for it.
Keeping streaks: a block bootstrap
When the rolling check reveals clustering, the bootstrap can be adjusted to respect it. Instead of drawing single days, a block bootstrap draws runs of consecutive days, for example five days at a time. Losing streaks inside a block stay together, while the order of the blocks is still shuffled:
int d=0;
while(d<len)
  {
   int k=(int)(Random()*(n-block+1));   // start of a random block
   for(int j=0; j<block && d<len; j++,d++)
     {
      low[d]  =eq*(1.0+dip[k+j]);
      eq      =eq*(1.0+ret[k+j]);
      close[d]=eq;
     }
  }
Block lengths of three to ten trading days cover most strategies. A useful habit is to report both numbers: if the single-day and block estimates are close, the days are close to independent and either can be used; if the block estimate is clearly lower, use it.
A practical workflow
Putting the pieces together, a sensible routine before buying a challenge looks like this:
- Record. Run the EA in the Strategy Tester on at least six months of real-tick data with the report included, using the same risk settings you plan to use on the challenge.
- Read the historical and rolling results. They show what really happened, and how much the outcome depended on the starting day.
- Read the bootstrap rates for every rule set you are considering. Firms differ in daily limits, drawdown type, targets and time limits; the same EA can be a good fit for one firm and a poor fit for another.
- Optimise for the pass rate, carefully. Use the custom criterion with a small number of parameters and check the best settings on a separate period. Optimising many parameters for the pass rate overfits just as easily as optimising for profit.
- Decide on risk last. The risk per trade is the strongest lever. Increase it step by step and watch the trade-off in the report: the pass rate rises at first, while the breach rate rises faster.
Frequently asked questions
Does the report work with multi-symbol EAs? Yes. It records account equity, not the result of one symbol, so it sees the combined effect of all positions.
Can it be used on a live account? The recording part can. Calling OnTick() on a live chart builds the same daily close and low arrays, which can be saved to a file and analysed with the same functions. For live monitoring of the limits themselves, a dedicated guard that enforces the rules is the right tool; this class only measures.
Why does a strategy with a good profit factor have a low pass rate? Usually because of the time limit. A profit factor of 1.5 with small, frequent trades may need months to reach +10%. The report makes this visible as a high share of "target not reached" outcomes rather than breaches.
Limitations
A bootstrap is a model, and its assumptions should be stated plainly:
- Days are treated as independent. Real markets have regimes: losing days tend to cluster in some periods. Shuffling days breaks these clusters and can make the estimate optimistic. A block bootstrap, which draws runs of consecutive days instead of single days, is a straightforward extension.
- The future is assumed to look like the test period. If the recorded period contains no crisis, neither will the simulated paths.
- The intraday low is only as good as the tick data. Use real ticks and a realistic spread and commission setup in the tester.
- At least a few months of data are needed. With fewer than about 60 recorded days, the collection is too small to produce varied paths.
None of these makes the method useless. They mean the pass rate is an estimate to compare strategies and settings with each other, not a promise.
Conclusion
A standard backtest tells you whether a strategy makes money. A prop challenge asks whether it makes enough, fast enough, without a single bad day. The CPropChallengeStats class bridges the two:
- it records each day's closing and lowest equity during any Strategy Tester run;
- it replays that path against several rule sets, including static and trailing drawdown, a profit target and a time limit;
- it estimates the pass rate with bootstrap resampling and returns it from OnTester() as a custom optimisation criterion;
- it can be complemented by rolling historical windows and a block bootstrap when losing days cluster in time.
Before paying for a challenge, run your EA through the tester with this report attached. If the estimated pass rate is low, the report usually shows why: too slow for the time limit, or too volatile for the daily limit. Both are problems that are much cheaper to discover in the tester than on a live challenge.
| File | Description |
|---|---|
| PropChallengeStats.mqh | The CPropChallengeStats class: equity path recording, rule checks, bootstrap pass rate and report. |
| ChallengeStatsDemo.mq5 | Example EA: a moving-average crossover used only to produce trades, with the challenge report and a custom optimisation criterion. |
Source code and ready-made tools
The full source files (PropChallengeStats.mqh and ChallengeStatsDemo.mq5) are attached to this post.
To protect a live challenge account once your EA passes these tests, see PropGuardian Prop Firm Risk Guard and Prop Firm Risk Calculator.




