Gold Trend Coach is not one more buy and sell signal indicator. Those draw an arrow and leave you alone. This one gives you the BUY or SELL signal with its Entry, its Stop Loss and its three Take Profit targets, and from that moment a mentor inside the panel tells you where the trade stands and what the next step is. It also teaches you the way we trade it. This guide explains what you see on the chart, what each part of the panel means, how we trade a signal, how the panel counts the results and which settings are worth touching. If you still have a question at the end, write to me in the MQL5 inbox and I answer the same day.
Gold Trend Coach MT5 on the Market
1. What it is and what it is not
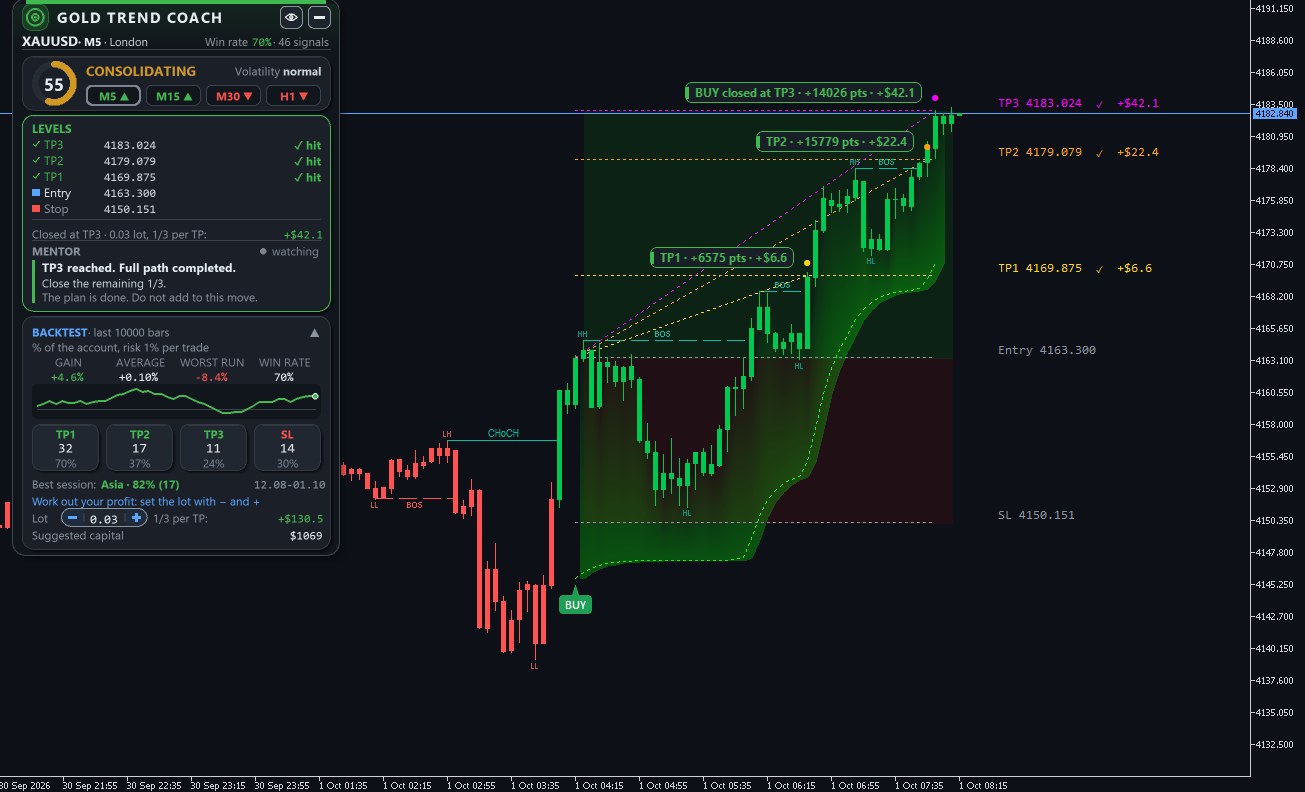
It is a trend indicator for gold (XAUUSD) on MetaTrader 5, for beginners and for experienced traders. On the close of the candle it prints a BUY or SELL signal with its Entry, its Stop Loss and its three Take Profit targets (TP1, TP2, TP3), and next to each level it shows what that level is worth in money for your lot.
Many people lose money buying indicators for one reason: the signal appears and they do not know what to do. They do not know why it came out, whether there is structure behind it, when to take profit or when to get out. They take the signal because it appeared, and there they are, alone with an open trade. This panel exists for that. The Mentor tells you why the trade opened, what comes next and what we would do at each point: new signal, on the way to TP1, TP1 reached, pullback, close to the stop, opposite signal. You have a road map, not an arrow.
And besides the signal, the indicator marks the market structure on the chart (BOS and CHoCH, the same marks you see in a Smart Money Concepts indicator) and colours the candles with that structure. With that we teach you the strategy we trade with: wait for the change of character in your favour and only then take the signal. It is a way of reading where price is going that serves you whether you are new or have years behind you, and it serves you even on the day you trade without arrows. If you like trading gold and want to understand structure, this indicator is for you.
It is not a bot. It does not open, close or move anything. It shows you the signal, the levels and what happened with each one, and you place the trade. Signals do not repaint: they print on the close of the candle and stay where they printed.
I would never publish a product I do not use. I use this one, and the statistics on the panel let you see it for yourself: every signal of the last 10,000 bars of your chart, winners and losers, with the worst losing run in plain sight. They are numbers from the past, they do not guarantee the future, but they do not lie. An indicator is a helper to decide better, not a promise of profit. What this one does is put the signal, the risk and the targets in front of you, warn you at the right moment and teach you to trade it with a trader's logic.
2. What you see on the chart
The signal. A BUY or SELL marker on the candle that just closed. If your alerts were on at that moment, it reached your terminal and your phone.
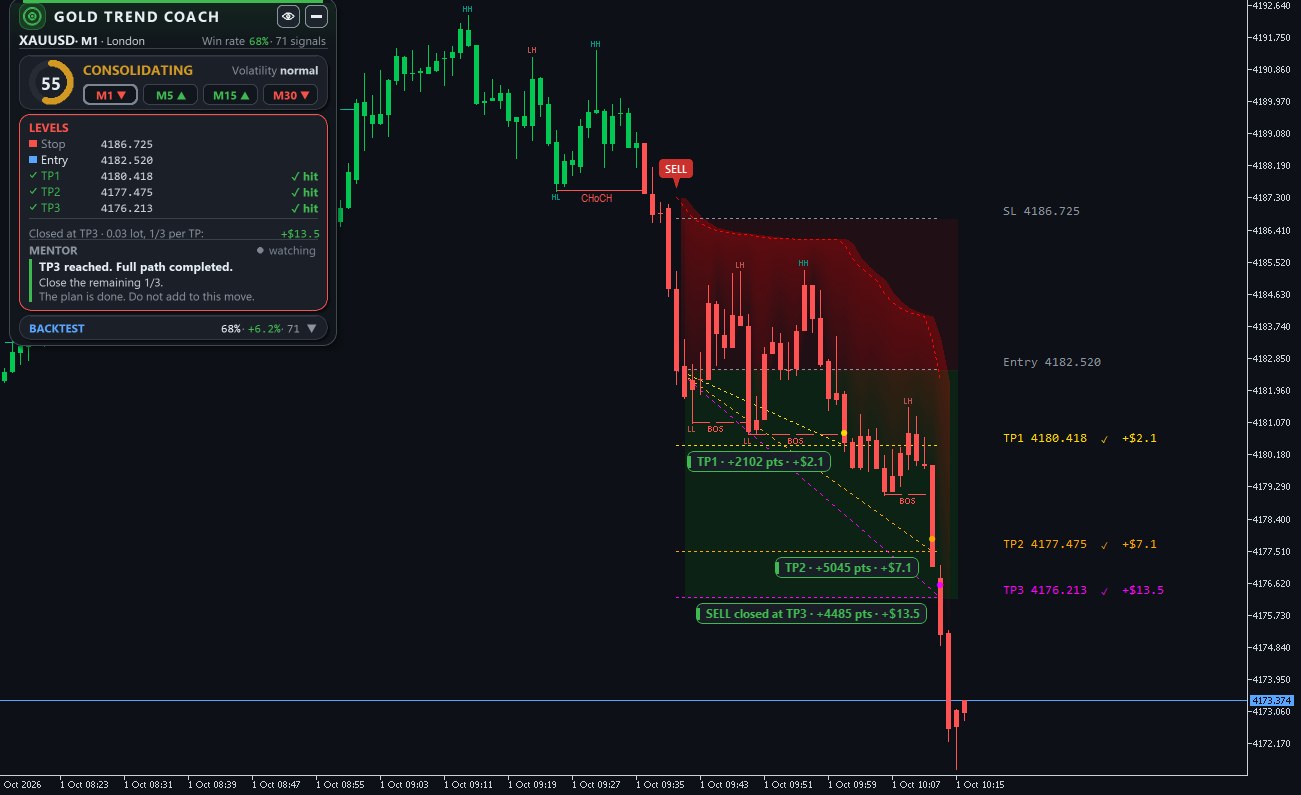
The levels. Entry at the close of the signal candle. Stop Loss at three times the volatility of the moment on M1 and M5, two and a half times on M15 and above. TP1 at half the stop distance, TP2 at 1.2 times, TP3 at 1.5 times. Every label carries the price and the money for your lot: you look at the Stop and you know what you risk, you look at TP3 and you know what is on the table.
The trade box. Red towards the stop, green towards TP3. Risk and road in one look. The shaded zone between the trend line and the price shows how the trend is accompanying the trade while it is open.
The coloured candles. Green when the market structure is bullish, red when it is bearish. One look tells you which side the market is on before you take the signal. Section 5 explains how that colour is decided.
BOS and CHoCH. The structure marks, the same as in a Smart Money Concepts indicator. They come built in, you do not need another indicator to see them.
The cards. When price reaches TP1, TP2 or closes the trade, a small card tells you the points and the money. A dotted line joins the entry with the level reached. The eye button on the panel hides them all if you want a clean chart.

3. The panel, part by part

1. Header. Symbol, timeframe and the session that is open (London, New York, Asia). On the right, the Win rate and how many signals there were in the window you are measuring. It is the percentage of signals that reached at least TP1.
2. Trend. A score from 0 to 100 of how clean the trend is, the volatility (low, normal, high) and four timeframes in a row, starting with the one on the chart. When the arrows point the same way as the signal, you have confluence. When they do not, the Mentor tells you.
3. Levels. TP3, TP2, TP1, Entry and Stop with price and money. Green check: reached. Below, one line sums up the current trade with your lot.
4. Mentor. It tells you in plain words where the trade stands and what we would do there: new signal, on the way to TP1, pullback, close to the stop, TP1 reached, TP2 reached, TP3, stop, opposite signal, news coming, signal against the structure. It is a guide, not an order. If your style is different, the Mentor keeps informing you just the same.
5. News. The next high-impact events of the symbol's currencies and the minutes left. Half an hour before and a quarter of an hour after, the Mentor turns amber to warn you. On the chart, a dotted vertical line marks each event. It opens and closes with the calendar button.
6. Backtest. What every signal of the last 10,000 bars of your chart did, winners and losers:
- Gain: net result as a percentage of the account, with 1 percent risk per trade.
- Average: what each signal left on average.
- Worst run: the worst run of losses in a row. Look at it before the Gain.
- Win rate: the same one as the header.
- The equity curve and the four boxes TP1, TP2, TP3 and SL: how many signals reached each one.
- Best session: in which session your chart did best, and the dates of the window.
- Lot with the - and + buttons. Change the lot and every dollar figure on the chart and on the panel changes with it. Next to it, what the window left with that lot closing one third at each TP.
- Suggested capital: twice the worst drawdown of the window with that lot, plus the margin. It is the floor to survive the worst run already seen, not a recommendation of how much to deposit.
The panel does not hide the losses. Every stop that happened is counted and every bad run is in Worst run. What you see is what happened on your chart with your broker's prices. Change the broker, the symbol or the timeframe and the numbers change.
You can drag the panel wherever you want, fold it with the - button of the header (a small tab stays with the current state) and change the language in PanelLanguage: English, Spanish, Portuguese, German, French, Italian and Russian.
4. How we trade a signal
This is the way we recommend. It is not the only one and it is not mandatory, it is the one that goes best with the three targets and it is how we trade it ourselves.
- Structure first, signal second. We do not take any BUY. We wait for a bullish CHoCH (the market just changed its character) and only then we take the BUY signal that comes after it. To sell, the same the other way round: bearish CHoCH and then the SELL. The coloured candles show it from afar: BUY with green candles, SELL with red candles. It is an optional filter, but it is the one that separates the good signal from the signal that arrives late.
- The alert arrives. Look at the arrows in the timeframe row. The one on your chart will match the signal. If one more timeframe points the same way, you have confluence, and that is enough for us. All four pointing the same way is a bonus, not a condition, and on M1 and M5 it does not happen often. If the signal goes against the structure, the Mentor tells you, and there many prefer to wait for the next one.
- Enter with 0.03 lots (or a multiple of three: 0.06, 0.09, 0.30) with the stop at the Stop Loss drawn on the chart. The panel already shows you what that stop is in dollars.
- TP1 is reached. Close 0.01 and keep 0.02. Here most traders move the stop to the entry: you already banked a part and what is left cannot lose. If your style is to leave the stop where it was, that is valid too, section 5 explains how the panel counts in that case.
- TP2 is reached. Close another 0.01 and keep 0.01. The stop goes up to TP1 if you are moving it.
- TP3 is reached. Close the last part. The card shows you the total of the trade.
- The opposite signal prints before TP3. Close whatever you have open. The card shows you what you got out with.
Another way, just as valid: 0.01 and let it run. Open 0.01, stop where it is drawn, and leave it until TP3 with your trailing. Fewer decisions, less screen time, and in a strong gold session it catches the whole move. On a sideways day it gives back more than closing partials.
And your own way. Many use the signal as the trigger inside their own analysis: order blocks, FVG, liquidity, support and resistance, higher timeframe bias. The levels are there to be used or to be replaced by yours.
About the lot. The Stop in dollars you see on the panel is what you lose if the signal fails. Compare it with your account before you enter, not after. If the stop of 0.03 looks big for your account, go down to 0.01 and trade the second way.
5. Market structure: BOS, CHoCH and the candles
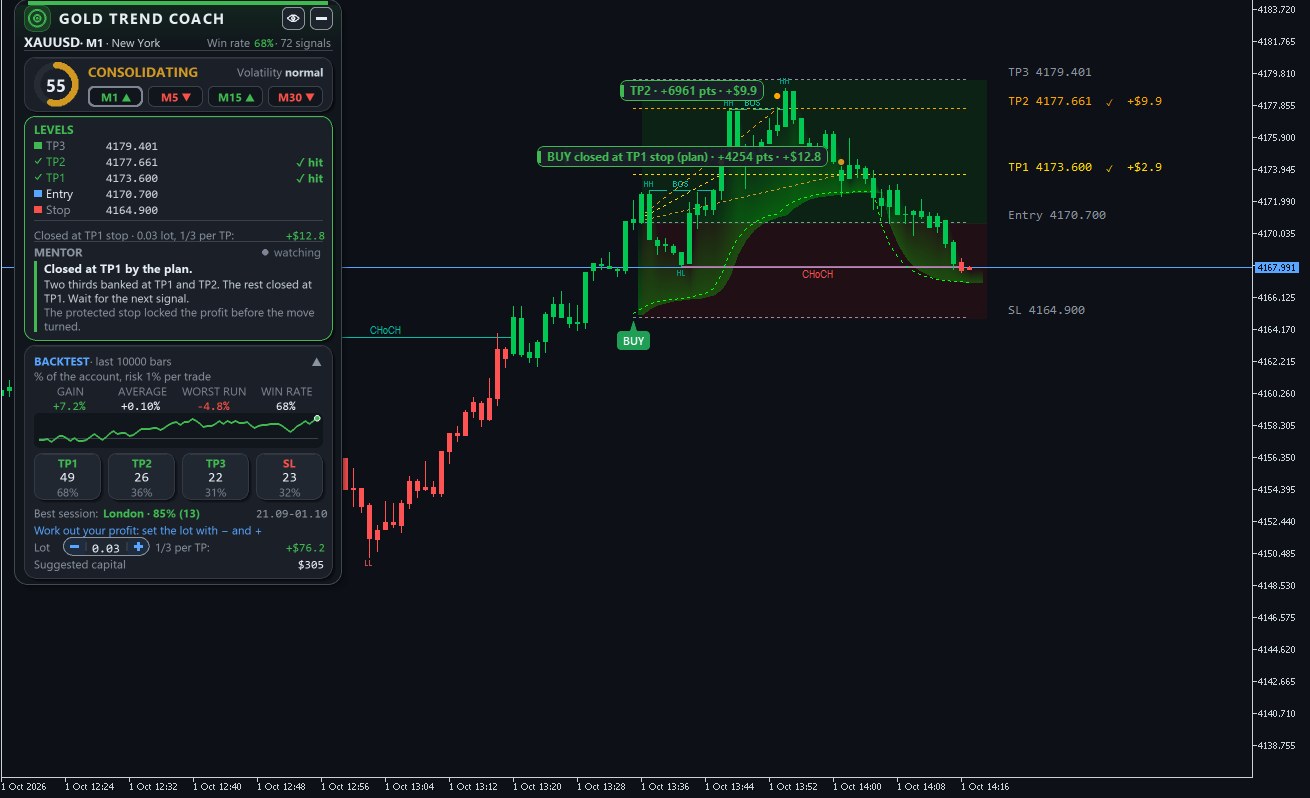
The swings are confirmed five bars later and labelled HH and HL when the structure is bullish, LH and LL when it is bearish. A close beyond the last swing in favour of the structure is a BOS (the trend continues, dashed line). The first close against it is a CHoCH (the trend may be turning, solid line). Everything is read on closed candles, so no mark moves or disappears afterwards. When you zoom out, the small labels hide by themselves and come back when you zoom in.
The structure is an additional filter, not a condition of the indicator. The signal prints with or without it. What it gives you is the view of what the market is doing: waiting for the CHoCH in your favour and then taking the signal is the way we filter, and it is the one we recommend in section 4.
The candles are painted with the structure: green from the last bullish BOS or CHoCH, red from the last bearish one. That is the default of CandleMode. The other options: Trend engine paints with the signal engine and turns the candles amber while a turn waits for confirmation, Both agree paints green or red only when engine and structure agree and amber when they do not, and Off leaves your candles as they are.
How to use it with the signals. A BUY after a bullish CHoCH, or with the BOS marks pointing up, is a signal in favour of the structure. A BUY with the candles still red is a signal against it, and the Mentor tells you: New BUY signal against the structure. That single filter, on M1 and M5, removes a good part of the signals that end at the stop.
How the panel counts after TP1. The panel counts the plan of section 4: after TP1 the stop goes to the entry, after TP2 to TP1. If price comes back to the entry after TP1, the panel closes that signal at breakeven with the TP1 third banked, and if price later goes on to TP2 or TP3, those levels turn grey with the note after exit, they are not added. If you trade with a fixed stop, your result on that signal will be different from the panel's, and that is fine: the panel measures one way of trading the signal, not yours.
6. Timeframes and sessions
With Settings on Auto the indicator loads a tested configuration for each timeframe on XAUUSD (M1, M5, M15, M30, H1, H4, and D1 takes the one of H4). There is nothing to calibrate.
| Timeframe | Who it is for | Closed bars to confirm the signal |
|---|---|---|
| M1 | Scalping, many signals, you need to be at the screen | 2 |
| M5 | Scalping with more room | 3 |
| M15 and M30 | Intraday, fewer and cleaner signals | 3 |
| H1 | Swing, a few per week | 3 |
| H4 and D1 | Position, a few per month | 1 |
Gold really moves in London and New York. In Asia there are fewer and slower signals. The Best session line of the panel tells you in which one your chart did best.
And one rule that applies to all of them: do not chase the price. If the alert reaches you with price already halfway to TP1, the stop is now twice as far compared with what you can make. Wait for the pullback or let it go. Gold gives several a day.
7. Alerts and Telegram
Popup, sound and push to the phone come on for every new signal. With AlertOnTpSlHit it also warns you when TP1, TP2, TP3 or the stop is reached, so you can manage the trade from your phone. For the push: in MetaTrader 5, Tools, Options, Notifications, and enter the MetaQuotes ID shown in the app.
Telegram. Every signal, every level reached, a report when the day closes and a photo of the chart when it loads, to your chat, group or channel. It does it through the Telegram Alert Bridge, a free utility that runs on any chart of the same terminal. Turn on EnableTelegramAlerts, pick the language and whether you want the screenshot, and write to me in the MQL5 inbox: I send you the bridge with its two-minute setup.
8. The settings worth touching
Everything else can stay as it comes.
| Setting | Default | What for |
|---|---|---|
| DisplayLot | 0.01 | The lot behind every dollar figure. The - and + buttons of the panel do the same. |
| CandleMode | Market structure | Candle colour (section 5). |
| ShowSignalHistory | false | true also draws the past signals on the chart. |
| ChartTheme | Dark | Dark, Light or Keep. Dark and Light give you your colours back when you remove the indicator. |
| HitLabelUnit | Both | Cards and labels in points, money or both. |
| BacktestWindowSize | 10000 bars | How much history the panel measures. It can also be a number of signals. |
| RiskPercent | 1.0 | The risk per trade behind the percentages of the backtest. |
| PanelScale | 100 | Panel size. 80 smaller, 120 bigger. |
| ShowStructure, ShowSwingLabels | true | BOS and CHoCH marks and the HH, HL, LH, LL labels. |
| NewsWindowBefore, NewsWindowAfter | 30, 15 | Minutes before and after a news event in which the Mentor warns you. |
| SettingsMode | Auto | Manual lets you set sensitivity, stop and targets by hand. For those who already know what they want to change. |
9. Questions I get often
Does it repaint? No. The signal prints on the close of the candle and does not move. The BOS and CHoCH marks are also read on closed candles.
Can I put it on several charts? Yes. It is built to sit on three or four gold charts at the same time, each with its own panel and its own count.
Does it work on other symbols? It is pure price action, so it runs on silver, forex pairs, indices and crypto. The Auto settings are tested on gold. On another symbol check the stop distance in dollars first.
The candles are not coloured. CandleMode on something other than Off. If you come from an earlier version, remove the indicator and put it back so it takes the new settings.
The News block says the calendar is not available. Your broker does not provide the MetaTrader economic calendar. The signals work just the same.
Why did the panel count a breakeven if price reached TP3? Because the signal closed at the entry before going on, following the plan of section 4. The grey levels show you how far it went afterwards. If you do not move the stop, your result on that signal is different from the panel's, and that is fine.
What if I start with two stops in a row? It happens, and it will happen again. Look at the Worst run box: there is the worst run your chart had in the last 10,000 bars, and the equity curve shows you how it went on afterwards. A signal indicator is judged over weeks and months of consistency, not over two days.
Can I connect my own EA to it? Yes. The signals are in buffers 2 (BUY) and 3 (SELL) and the trend line in buffers 0 and 1, always reading the closed candle. The levels of the current trade are the objects GTC.Line.Entry, GTC.Line.Stop, GTC.Line.TP1, GTC.Line.TP2 and GTC.Line.TP3.
10. Support
MQL5 inbox, in English or Spanish, I answer the same day. If you see something odd, tell me the symbol, the timeframe, the broker and send a screenshot. Updates come first on my channel Xander Trading Tools, and in the group Xander Lab you can share screenshots and questions with the other buyers.
Trading involves risk. The indicator shows you the signal and what happened with each one. The decision and the risk of every trade are yours.