FXB Confluence Engine for MT4 and MT5: User Guide and Trading Manual

1. Introduction
FXB Confluence Engine is a trend indicator for MetaTrader 4 and MetaTrader 5 that scores every turn of the trend before it shows a signal. It follows the trend with a range filter, and each time that trend turns on a closed bar it measures how much of the market agrees: momentum and the EMAs, four other timeframes, a higher-timeframe bias, the same filter at two wider settings, volatility, RSI and volume add points, and a choppy market takes points away. A BUY or SELL prints only when the score reaches your minimum and every filter you have switched on is open.
This guide covers version 1.00 on both platforms: installation, the chart, the dashboard, all 64 inputs, alerts and three ways to trade with it.
Key features:
- Range filter trend with a four-layer trailing band and candles coloured by the trend
- Ten-layer score, out of 16 at the defaults, read as HIGH, MED, LOW or WEAK
- Gated signals on closed bars: EMA alignment, ADX, Choppiness Index, cooldown, RSI, volume and a minimum score
- Dashboard with the score breakdown, every gate, market data, session and the state of the last signal
- Bottom strip: the trend on five timeframes and at five sensitivities
- Pivot levels: Classic, Fibonacci or Camarilla, from the previous day, week or month
- Ten alert families through popup, sound, push notification and e-mail
- Same engine on MT4 and MT5: identical inputs, signals and dashboard values
Get the indicator (a free demo is available on both pages):
- MetaTrader 5: FXB Confluence Engine MT5
- MetaTrader 4: FXB Confluence Engine MT4
TIP: The indicator scores, draws and alerts. It does not draw a stop loss or targets, and it does not place trades. Decide your stop, target and position size before you act on a signal, and try every change of settings on a demo account first.
2. How the Indicator Works
The trend: a range filter
The range filter is a line that follows price but only moves when price travels further than a range sized from the ATR. Its direction is the trend. The width scales with Sensitivity / 8 (Sensitivity 6), with ATR Length 14 and ATR Multiplier 0.8; a higher Sensitivity flips the trend less often. When the trend turns on a closed bar, that bar is a signal candidate, judged by the score and the gates.
The score: ten layers
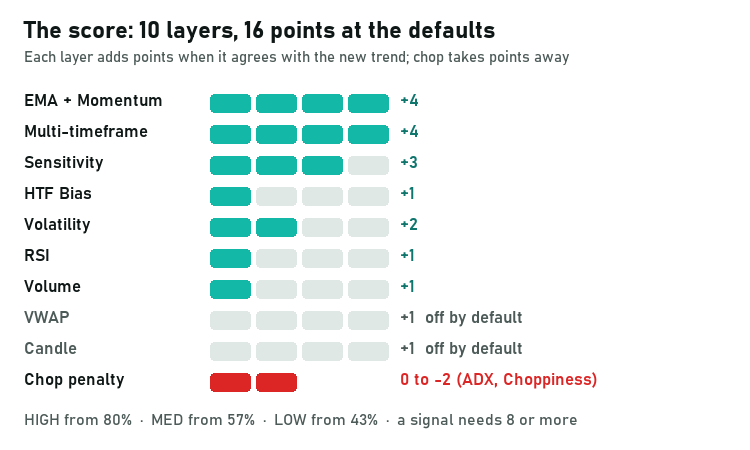
| Layer | Points | What earns them |
|---|---|---|
| EMA + Momentum | up to 4 | Fast EMA against slow EMA, price against the fast EMA, and momentum (rate of change over 5, 10 and 20 bars) agreeing with the trend |
| Multi-timeframe | up to 4 | How many of M5, M15, H1 and H4 agree with the trend on this chart |
| Sensitivity | up to 3 | The same filter at sensitivity 12 (two points) and 16 (one point) agreeing |
| HTF Bias | up to 1 | The higher timeframe agreeing |
| Volatility | up to 2 | One point each when ATR and ATR as a share of price are not at the top of their last 60 bars |
| RSI | up to 1 | RSI on the trend's side of its threshold |
| Volume | up to 1 | Volume at or above its average |
| VWAP | up to 1 | Price on the trend's side of VWAP (off by default) |
| Candle | up to 1 | An engulfing or strong-body candle (off by default) |
| Chop penalty | 0 to -2 | Minus one when ADX is below its threshold, minus one when the Choppiness Index is above its maximum |
With VWAP and Candle off, the maximum is 16. Switching a layer off removes it from the maximum too, so the score always reads against what is switched on. The score is calculated on every bar, so the dashboard always shows how much agrees with the current trend.
| Band | Share of the maximum | At the default maximum of 16 |
|---|---|---|
| HIGH | 80 percent or more | 13 to 16 |
| MED | 57 percent or more | 10 to 12 |
| LOW | 43 percent or more | 7 to 9 |
| WEAK | below 43 percent | 6 or less |
The gates: what a signal needs
A BUY prints when, on a closed bar, the range filter turns up and every gate is open. A SELL is the mirror image.
| Gate | Default | Condition at the defaults |
|---|---|---|
| EMA alignment | On | Fast EMA (60) above slow EMA (200), price above the fast EMA, fast EMA rising |
| Chop gate | On | ADX at or above 20.0, Choppiness Index at or below 61.8, cooldown of 5 bars clear |
| RSI | On | RSI at or above 50.0 (at or below 50.0 for a SELL) |
| Volume | On | Volume at or above its 20-bar average times 1.0 |
| VWAP | Off | Price above the daily VWAP (below for a SELL) |
| Candle pattern | Off | An engulfing or strong-body candle in the signal's direction |
| EMA distance | Off | Price within 2.0 ATR of the fast EMA |
| Minimum Signal Strength | 8 | A score of 8 or more |
If the trend turns while a gate is shut, no signal prints for that turn, and the CONFIRMATIONS section of the dashboard shows which gate held it.
NOTE: The signal, its score, every gate and every alert are evaluated on the closed bar. A diamond appears when its bar has closed, in practice when the next bar opens, and once printed it does not move or disappear. What moves on the forming bar is the filter line, the band, the candle colour and the dashboard, because they follow live price until the bar closes. Incremental updates were checked against a fresh full recalculation on broker data: 3,000 bars by 140 values per chart, zero differences.
3. Installation from the MQL5.com Market
Install directly from the MQL5.com Market. The steps are the same in MetaTrader 4 and MetaTrader 5, and no manual file copying is required.
Product pages:
- MetaTrader 5: FXB Confluence Engine MT5
-
MetaTrader 4: FXB Confluence Engine MT4
-
Purchase the indicator on its product page, or download the free demo. You can also search for it in the Market tab of the terminal's Toolbox window.
- The indicator installs automatically after purchase into the terminal logged in with your MQL5.com account (Tools > Options > Community).
- Restart MetaTrader, or right-click Indicators in the Navigator and choose Refresh.
- Open the Navigator (Ctrl+N) and find it under Navigator > Indicators > Market.
- Drag it onto a chart, review the inputs and click OK.
Keep the defaults on your first chart. The filter line, band and coloured candles appear across the history with a diamond on every past signal, the dashboard opens top right, and alerts for signals and Trade Invalidated are on as popups. On a symbol you have not opened before, the dashboard can take a few seconds to fill while the terminal downloads the other timeframes' history.
NOTE: A free demo version is available for testing. Market demos run in the Strategy Tester: start a visual test to see the signals, dashboard and strip on history. Alerts never fire in the tester, so the demo shows everything except alerts.
4. Reading the Chart
With the default Dark theme:
| On the chart | Meaning |
|---|---|
| Violet line | The range filter, the trend line everything is measured from |
| Four shaded layers either side | The trailing band, teal in an uptrend, red in a downtrend |
| Coloured candles | The trend: teal up, red down (Paint Bars) |
| Blue and orange lines | Fast EMA (60) and slow EMA (200) |
| Diamond with BUY or SELL text | A signal on that closed bar: below the low for a BUY, above the high for a SELL |
| Score label (optional) | With Show LONG/SHORT Labels on, for example BUY 11/16 |
| Horizontal lines with labels | Pivot levels P, R1 to R4, S1 to S4 |
| Panel, top right | The dashboard (Section 5) |
| Strip, bottom centre | Five timeframes and five sensitivities (Section 6) |
Pivots come from the previous day by default (D1), or the previous week or month, with the Classic formula unless you choose Fibonacci or Camarilla. Each line starts 100 bars before the current period and is labelled with its name and price in the symbol's own decimals. A level price has broken through changes colour. The levels also feed Near Sup and Near Res on the dashboard.
MetaTrader 4 draws the band and the coloured candles with histogram bars, and shows some dashboard symbols as plain characters: ^ and v for arrows, + and x for ticks and crosses. The values are identical on both platforms.
5. The Dashboard, Section by Section
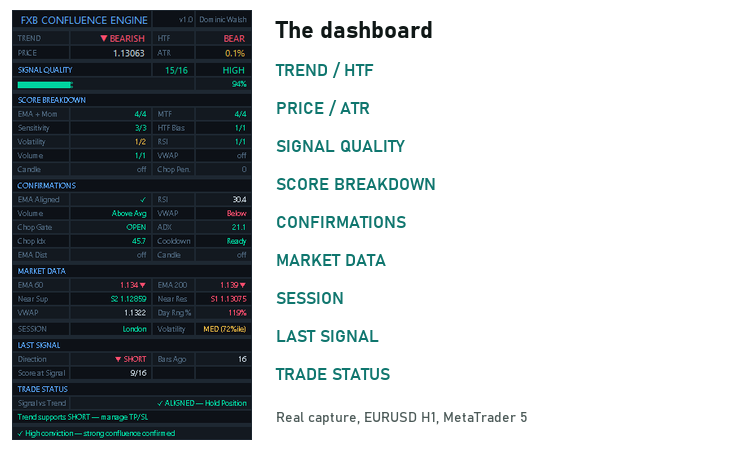
| Section | What it shows |
|---|---|
| Header | Product name, version and author (Kestutis Balciunas) |
| TREND / HTF | The confirmed trend on this chart and the higher-timeframe bias (HTF Timeframe, M30 by default) |
| PRICE / ATR | The last price, and ATR as a percentage of price |
| SIGNAL QUALITY | The score as n/max, its band, a 14-cell bar and the percentage |
| SCORE BREAKDOWN | Every layer with its points, or off, and Chop Pen. for the chop penalty |
| CONFIRMATIONS | EMA Aligned, RSI value, Volume Above or Below Avg, VWAP side, Chop Gate OPEN or BLOCKED, ADX value, Chop Idx value, Cooldown Ready or counting, EMA Dist and Candle |
| MARKET DATA | EMA 60 and EMA 200 with their slope, Near Sup and Near Res (closest pivots below and above price), VWAP, and Day Rng % (today's range against the average daily range) |
| SESSION / Volatility | London (08:00 to 16:00 London time), New York (09:30 to 16:00 New York time), LDN+NY overlap, Asian (00:00 to 09:00 Tokyo time) or Off-Hours, daylight saving handled; volatility LOW, MED or HIGH with its ATR percentile |
| LAST SIGNAL | Direction, Bars Ago and Score at Signal |
| TRADE STATUS | Signal vs Trend: ALIGNED, Hold Position or REVERSED, Consider Exit; a plain-words line such as Trend supports LONG, manage TP/SL or Trend now BEARISH, close LONG or tighten SL; and a tip line: High conviction, Moderate, Low confluence or Weak signal |
A missing signal. If the trend turned without a signal, read CONFIRMATIONS: the first gate showing a cross (x on MT4) or BLOCKED held it. Chop Gate BLOCKED with ADX below 20.0, for example, means the market was not trending enough.
An open trade. ALIGNED means the trend still points the way of the last signal. REVERSED means it has turned against it, which is when the Trade Invalidated alert fires.
6. The Bottom Strip
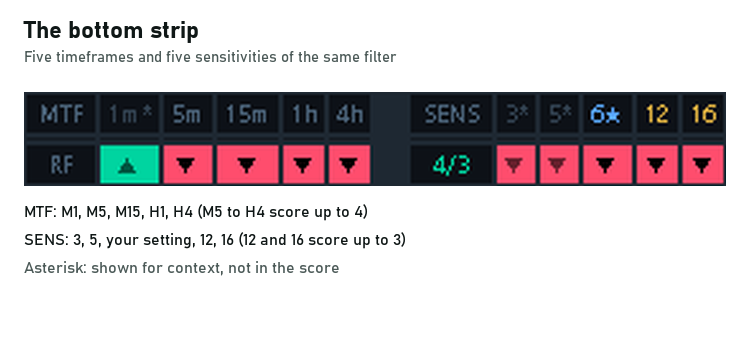
- MTF: the trend of the same filter on M1, M5, M15, H1 and H4. M1 is marked with an asterisk and is context only; M5 to H4 form the Multi-timeframe layer, up to 4 points.
- SENS: the filter on this chart at sensitivity 3, 5, your setting (marked with a star), 12 and 16. The starred 3 and 5 are context only; 12 and 16 form the Sensitivity layer, up to 3 points.
- Middle cell: the multi-timeframe score and the sensitivity score, for example 4/3.
The five timeframes are fixed, so on H4 and above they describe agreement inside the move; the HTF row of the dashboard is the one that looks up. On a forming bar the 12 and 16 cells show the live trend while the score uses the last closed bar, so the two can briefly disagree.
7. Input Parameters Reference
All 64 inputs, in the order and groups of the inputs dialog.
Pivot Levels
| Input | Default | What it does |
|---|---|---|
| Show Pivot Levels | On | Draws P, R1 to R4 and S1 to S4 of the previous period. Off also blanks Near Sup and Near Res |
| Pivot Timeframe | D1 | The previous day, week or month |
| Pivot Formula | Classic | Classic, Fibonacci or Camarilla |
| Show Pivot Labels | On | Name and price next to each line |
| Extend Lines Left (bars) | 100 | Bars before the current period where the lines begin |
Core
| Input | Default | What it does |
|---|---|---|
| Sensitivity | 6 | Width of the range filter. Higher means fewer trend flips and rarer signals. Scales with Sensitivity / 8 |
| ATR Length | 14 | ATR period behind the filter width and the band |
| ATR Multiplier | 0.8 | Scales the filter width and the band |
Higher Timeframe
| Input | Default | What it does |
|---|---|---|
| HTF Timeframe | M30 | Feeds the HTF Bias layer (one point) and the TREND / HTF row |
| HTF MA Length | 90 | No effect in this version; kept so saved settings keep loading |
EMA Overlay
| Input | Default | What it does |
|---|---|---|
| Show EMA Lines | On | Draws the fast and slow EMAs |
| Fast EMA | 60 | Used by the EMA + Momentum layer and the EMA alignment and distance filters |
| Slow EMA | 200 | Fast EMA above it is bullish alignment, below it bearish |
Anti-Chop Filters
| Input | Default | What it does |
|---|---|---|
| Enable ADX Filter | On | Blocks signals while ADX is below the threshold, and takes one point off the score |
| ADX Length | 14 | ADX period |
| ADX Threshold | 20.0 | Minimum ADX for a trend. 20 is moderate, 25 strict |
| Enable Choppiness Index Filter | On | Blocks signals while the Choppiness Index is above the maximum, and takes one point off |
| Choppiness Length | 14 | Choppiness Index period |
| Choppiness Max | 61.8 | Highest value that still counts as trending; lower is stricter |
| Enable Signal Cooldown | On | Blocks the next signal until Cooldown Bars have closed |
| Cooldown Bars | 5 | Minimum closed bars between two signals |
Signal Confirmation
| Input | Default | What it does |
|---|---|---|
| Enable RSI Confirmation | On | A BUY needs RSI at or above RSI Min for Longs, a SELL at or below RSI Max for Shorts. One point when RSI agrees |
| RSI Length | 14 | RSI period |
| RSI Min for Longs | 50.0 | Lowest RSI that allows a BUY |
| RSI Max for Shorts | 50.0 | Highest RSI that allows a SELL |
| RSI Overbought Level | 70.0 | For the RSI alert and dashboard; does not block signals |
| RSI Oversold Level | 30.0 | For the RSI alert and dashboard; does not block signals |
| Enable Volume Confirmation | On | Volume must be at or above its average times the multiplier. One point. Forex volume is tick volume |
| Volume MA Length | 20 | Length of the volume average |
| Volume Threshold Multiplier | 1.0 | 1.0 means at least average |
| Enable VWAP Confirmation | Off | BUY above the daily VWAP, SELL below. Adds one point to the score and the maximum |
| Enable Candle Pattern Confirmation | Off | Needs an engulfing or strong-body candle. Adds one point to the score and the maximum |
| Enable EMA Distance Filter | Off | Blocks signals when price is too far from the fast EMA |
| Max EMA Distance (ATR mult) | 2.0 | That maximum distance, in ATRs |
| Minimum Signal Strength | 8 | Signals scoring below this are not shown. Out of 16 at the defaults |
Display
| Input | Default | What it does |
|---|---|---|
| Show LONG/SHORT Labels | Off | A score label such as BUY 11/16 at each signal |
| Show Signal Arrows | On | The diamond and BUY or SELL text |
| Show Range Filter Line | On | Draws the filter line |
| Show Trailing Band | On | The four shaded layers, coloured by the trend |
| Show Background Tint | Off | Tints the background green or red by the trend |
| Only show signals when EMA aligned | On | Requires full EMA alignment. Filters the signal itself, not only the display |
Dashboard
| Input | Default | What it does |
|---|---|---|
| Show Dashboard | On | Shows the main panel |
| Dashboard Position | Right | Top left or top right |
| Dashboard Text Size | Small | Tiny, Small or Normal |
| Show Bottom Strip (MTF + Sensitivity) | On | Shows the bottom strip |
Theme
| Input | Default | What it does |
|---|---|---|
| Chart Background | Dark | Dark or Light palette; changes no calculated value |
MetaTrader
| Input | Default | What it does |
|---|---|---|
| Paint Bars | On | Colours the candles: teal up, red down |
| Bars to calculate (0 = all) | 5000 | Recent bars calculated; 0 means the whole history |
| Server time zone (session row) | Auto | Used only for the session row; Auto reads the broker's clock |
Alerts
| Input | Default | What it does |
|---|---|---|
| Enable alerts | On | Master switch for every alert |
| Alert: BUY and SELL signals | On | Every signal |
| Alert: Strong signals (score 80%+) | Off | Signals at 80 percent of the maximum or more |
| Alert: EMA-confirmed signals | Off | Signals with full EMA alignment |
| Alert: Trend change | Off | The trend turning |
| Alert: Chop gate opened / closed | Off | The anti-chop gate changing state |
| Alert: HTF bias change | Off | The higher-timeframe bias turning |
| Alert: RSI enters overbought / oversold | Off | RSI entering either zone |
| Alert: Volume spike | Off | Volume at twice its average |
| Alert: Score crosses the minimum | Off | The score crossing Minimum Signal Strength |
| Alert: Trade invalidated | On | The trend reversing against the last signal |
| Channel: popup window | On | MetaTrader's alert window |
| Channel: sound | On | alert.wav, only when the popup is off |
| Channel: push notification | Off | The MetaTrader app on your phone |
| Channel: e-mail | Off | The terminal's mail settings |
8. Alert Configuration
Ten alert families, each reaching you through four channels. Every alert is evaluated on a closed bar, fires once for that bar, and never fires for history or in the Strategy Tester.
| Family | Default | Fires on |
|---|---|---|
| BUY and SELL signals | On | A signal, with price, score, HTF bias, RSI and volume in the message |
| Strong signals (score 80%+) | Off | A signal scoring at least 80 percent of the maximum |
| EMA-confirmed signals | Off | A signal on a bar with full EMA alignment |
| Trend change | Off | The confirmed trend turning bullish or bearish |
| Chop gate opened / closed | Off | The gate opening (signals allowed) or closing (signals blocked) |
| HTF bias change | Off | The higher-timeframe bias turning |
| RSI enters overbought / oversold | Off | RSI entering a zone, once on entry, not on every bar inside it |
| Volume spike | Off | Volume at twice its average |
| Score crosses the minimum | Off | The score crossing Minimum Signal Strength, up or down |
| Trade invalidated | On | The trend reversing against the last signal |
Message format. Signal alerts carry the context in one line; the others name the event, symbol and timeframe:
FXB-CE LONG | EURUSD | H1 | Price: 1.16377 | Score: 12/16 (MED) | HTF: BULL | RSI: 52.2 | Vol: Above Avg FXB-CE TRADE INVALIDATED | EURUSD | H1 | Close LONG - trend reversed to BEARISH | Price: 1.16102 FXB-CE TREND CHANGE | EURUSD | BEARISH | H1
Channels. Popup (On) needs no setup. Sound (On) plays alert.wav only when the popup is off, because the popup plays its own sound; for sound without the window, set popup Off and keep sound On. Push notification and e-mail are Off until you set them up:
- Push: find the MetaQuotes ID in the settings of the MetaTrader app on your phone. In the desktop terminal open Tools > Options > Notifications, enable push notifications, enter the ID and click Test. Then set Channel: push notification to On.
- E-mail: open Tools > Options > Email, enter your mail server, login, password and the From and To addresses, and click Test. Then set Channel: e-mail to On.
Recommended setup: Signals plus Trade Invalidated, the default pair: one tells you a setup has printed, the other that the trend has turned against it. Add push when you are away from the desk. Chop gate and Score crosses the minimum fire on state changes and are noisy. Alerts only fire while the terminal runs; use a VPS for round-the-clock alerts.
9. Trading Strategies
The indicator does not draw a stop or targets, so each strategy uses the same references for planning them.
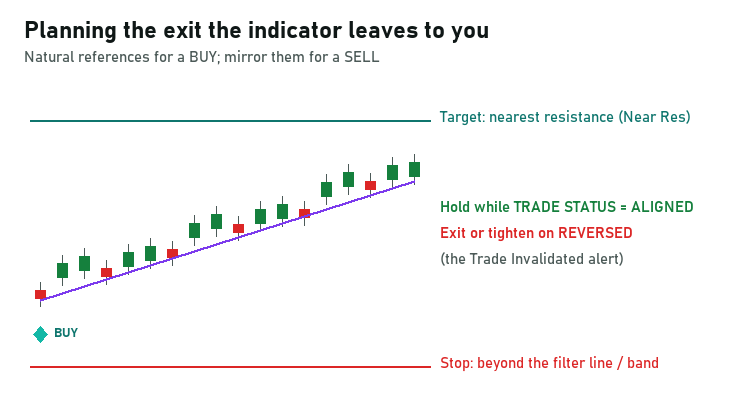
- Entry: around the open of the bar after the signal, since the diamond appears when the signal bar closes.
- Stop: beyond the range filter line, the far edge of the band, or the signal bar's extreme. Size the position so that distance is a risk you accept.
- Target: Near Res for a BUY, Near Sup for a SELL, the first pivot levels in the way.
- Management: hold while TRADE STATUS reads ALIGNED. On REVERSED, when Trade Invalidated fires, close or tighten the stop.
Strategy 1: Default trend-continuation entries
At the defaults every signal has full EMA alignment: the range filter has turned back in the direction of the EMAs after a pullback. Read the score before acting. 8 of 16 passed the minimum, 13 or more is HIGH, and SCORE BREAKDOWN shows what was missing; a Multi-timeframe layer at 1/4 means only one of the four timeframes agrees.
On the last 1,000 closed bars of 20 MetaTrader 5 charts the defaults gave 5 to 14 signals; on 13 MetaTrader 4 charts, 3 to 13. A count tells you how busy a chart will be, not how many signals work.
Strategy 2: Higher-score signals only
Raise Minimum Signal Strength. At the default maximum of 16, a minimum of 10 keeps the MED and HIGH bands, and 13 keeps HIGH only. Fewer signals print; this count was not measured, so check it on your own charts' history. To keep every signal on the chart but be alerted only to the high ones, leave the minimum at 8, switch Alert: Strong signals (score 80%+) on and Alert: BUY and SELL signals off.
For the exit, one plan that fits is to close part of the position at the first pivot target and trail the stop on the rest behind the filter line while TRADE STATUS reads ALIGNED. Switching VWAP or Candle on raises the maximum by one point each, so re-check your minimum afterwards.
Strategy 3: More signals (EMA alignment filter off)
Set Only show signals when EMA aligned to Off. On the same 20 MetaTrader 5 charts this alone raised the count from 5 to 14 signals per 1,000 bars to 9 to 24. The extra signals include counter-trend turns against the EMAs.
- Read EMA Aligned in CONFIRMATIONS for each signal: a tick means with the EMAs, a cross means against them.
- Against the EMAs, treat the slow EMA as the first obstacle and take the first target at the slow EMA or the nearest pivot, whichever is closer.
- Keep the stop at the filter line or band edge, and consider a smaller position on counter-trend signals.
- To be alerted only to aligned signals, switch Alert: EMA-confirmed signals on and Alert: BUY and SELL signals off.
TIP: Keep a log of the signals you take and skip, with their scores. Test any change of settings on a demo account first.
10. Troubleshooting
Dashes in some dashboard rows. Another timeframe's history is still loading, or your broker serves none for it. The rows fill when the data arrives. Some servers serve no M1 history, which only affects the M1 cell of the strip. Near Sup and Near Res also show a dash when Show Pivot Levels is off.
The trend turned but no signal printed. A gate was shut. CONFIRMATIONS shows the first gate with a cross or BLOCKED; most often it is EMA alignment, the chop gate or the cooldown. A score below Minimum Signal Strength also holds a signal, which SIGNAL QUALITY shows.
The session row looks wrong. Auto reads your broker's clock and works for almost every broker. If yours keeps unusual server time, set Server time zone (session row) to a fixed offset. It changes the session row only, never a signal or the score.
Slow loading on a long chart. Bars to calculate (5000) limits the work to recent history; 0 calculates everything and takes longer. Raise it only to see signals further back.
No push notification or e-mail. Check the channel is On in the inputs and the terminal passes its Test under Tools > Options > Notifications or Email. A popup proves the indicator is firing. Alerts fire only on closed bars, only while the terminal runs, never in the tester.
Not in the Navigator. Restart or refresh, and check the terminal is logged in with the MQL5.com account you bought with (Tools > Options > Community). Look under Indicators > Market.
11. FAQ
Q: Does it repaint? A: Signals do not. The signal, score, gates and alerts are decided on the closed bar, and a printed diamond stays. The filter line, band, candle colour and dashboard follow the forming bar until it closes.
Q: Which timeframes can I use? A: Any. The charts measured for this guide were M15, M30, H1 and H4. The Multi-timeframe layer always reads M5, M15, H1 and H4; HTF Timeframe (M30) feeds the HTF Bias layer, so set it above your chart's timeframe if you want that layer to look up.
Q: Which markets? A: Any symbol, because it reads price and volume only. The measured charts covered forex, gold and silver, indices, oil and crypto. Volume on most forex and CFD symbols is tick volume.
Q: Where do the stop and targets go? A: The indicator draws neither. Use the filter line, band edge or signal bar's extreme for the stop and Near Res or Near Sup for the first target (Section 9).
Q: What differs between MT4 and MT5? A: Only the drawing. MT4 draws the band and candles with histogram bars and uses ^, v, + and x on the dashboard. Engine, inputs, signals and dashboard values are the same.
Q: Why is there no win rate? A: A win rate depends on the exit, and the indicator does not manage exits. The same signal can win with one stop and target and lose with another, so a single figure would describe an exit rule you may not use. Test your own exit plan on a demo account.
Q: Do alerts work in the Strategy Tester? A: No, and not for history either. The demo, which runs in the tester, shows signals, dashboard and strip but no alerts.
Q: Can I run it on several charts? A: Yes. Each chart has its own copy, dashboard and alerts, and every alert names its symbol and timeframe.
12. Support and Contact
Product pages:
- MetaTrader 5: FXB Confluence Engine MT5
- MetaTrader 4: FXB Confluence Engine MT4
Getting help:
- Post general questions in the Comments section of the product page, so the answer helps other users too.
- Send a private message for anything about your account or purchase.
- Include your platform (MT4 or MT5) and build, broker, symbol and timeframe, any inputs you changed, a screenshot with the dashboard visible, and any message from the Experts tab.
Updates arrive through the MQL5 Market. A free demo version is available for testing before purchase.
13. Risk Disclaimer
Trading foreign exchange, contracts for difference, crypto assets and other leveraged instruments carries a high level of risk and may not be suitable for all investors. Leverage amplifies both profits and losses, and you can lose more than your deposit.
FXB Confluence Engine is an analysis tool. It does not place, modify or close orders, and no signal, score or alert is a recommendation to trade. The figures and signal counts in this guide describe what the indicator drew on real prices; they are not trading results and do not predict future results. Use a stop loss, practise on a demo account first, and only trade with capital you can afford to lose. The developer accepts no liability for trading decisions made with this tool.




