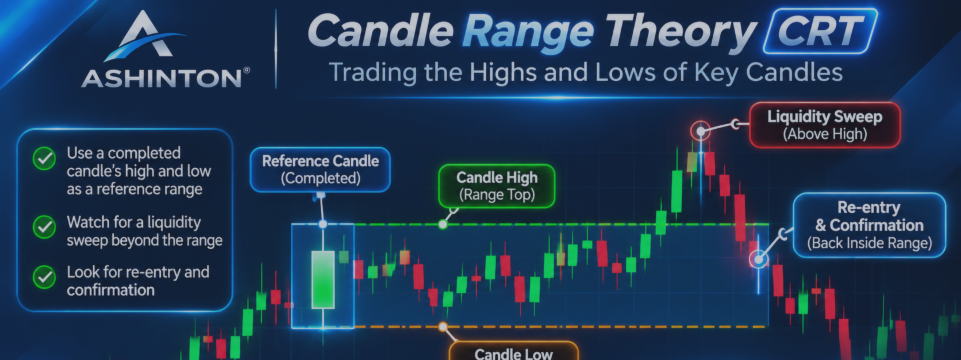

In trading, some of the most useful information can be found in the highs and lows of previous candles.
Every completed candle represents a period of price activity. Its high and low establish a range that traders can monitor for potential liquidity sweeps, breakouts, reversals and changes in market direction.
Candle Range Theory (CRT) is a trading approach built around this idea. It focuses on the relationship between a selected candle's high, low and subsequent price behaviour.
Rather than treating every price movement as an isolated event, CRT encourages traders to observe how price interacts with previously established candle ranges.
Let's explore how it works.
What Is Candle Range Theory?
Candle Range Theory uses the high and low of a completed candle as important reference levels.
The selected candle can come from different timeframes, depending on the trader's methodology. It might be a 4-hour candle, a daily candle or another meaningful reference period.
Once the candle closes, its high and low establish a defined price range. Traders then monitor how subsequent candles interact with these boundaries.
The central idea is straightforward:
- The candle high defines the upper boundary.
- The candle low defines the lower boundary.
- Price movement beyond either boundary may provide information about liquidity and market direction.
- Subsequent price action helps determine whether the move represents a genuine breakout or a potential reversal.
The range becomes a framework for analysing price behaviour.
Understanding the Three Main Stages
A commonly used CRT trading model can be understood through three stages.
Stage 1: Establish the Candle Range
Start by identifying a completed reference candle. Mark its high and low on the chart. These two prices establish the range that will be monitored.
Stage 2: Watch for a Liquidity Sweep
A potential CRT setup develops when price moves beyond one side of the established range. For example, price may trade above the previous candle high, temporarily moving beyond the upper boundary.
This movement can be interpreted as a potential liquidity sweep, particularly when traders are watching for stops and breakout orders around previous highs.
However, a move beyond the high does not automatically indicate a reversal. The important question is what price does next.
Stage 3: Look for Re-entry and Confirmation
In a common CRT interpretation, traders watch for price to move beyond a range boundary and subsequently close back inside the original range.
For example:
- Price moves above the previous candle high.
- The move fails to sustain itself.
- A candle closes back below the previous high.
- Traders monitor subsequent price action for possible bearish confirmation.
The opposite applies to a sweep below the previous candle low followed by a close back inside the range.
Some traders use the opposite side of the reference candle as a potential target. Others use additional market structure, lower-timeframe confirmation and predefined risk-to-reward criteria.
The exact entry and exit rules vary between CRT methodologies.
Why Higher-Timeframe Candle Levels Matter
One of the most useful aspects of CRT is the ability to combine higher-timeframe reference levels with lower-timeframe analysis.
A daily candle provides a broader reference range, while a 15-minute or 5-minute chart allows traders to observe more detailed price behaviour around that range.
Consider this workflow:
- D1: Identify the previous daily candle high and low.
- H4: Observe how price develops around the daily range.
- M15: Monitor potential sweeps, re-entry and price confirmation.
- M5: Refine execution if your trading strategy requires it.
This approach helps maintain a broader market perspective while analysing lower-timeframe price movements. It also reduces the need to repeatedly switch between charts just to identify important candle boundaries.
Common Mistakes When Applying CRT
Although the concept is relatively straightforward, traders can make several mistakes when applying it.
Treating every breakout as a liquidity sweep
Price moving beyond a previous high or low does not automatically mean a reversal is coming. Genuine breakouts happen.
Entering without confirmation
A temporary move beyond a candle boundary is not, by itself, sufficient confirmation for a trade.
Ignoring the broader market structure
A candle-range setup should be considered alongside the prevailing market environment, relevant support and resistance areas and overall price behaviour.
Using unfinished candles
Reference levels should be based on completed candles when applying a historical candle-range methodology. Otherwise, the reference range may change before the candle closes.
Neglecting risk management
Even well-structured setups can fail. Traders should define their invalidation points, position sizes and acceptable risk before entering a trade.
A Practical Way to Apply CRT on MetaTrader 5
For traders studying Candle Range Theory, manually identifying and monitoring previous candle highs and lows can become repetitive, especially when analysing several instruments and timeframes.
A practical chart setup is to:
- Select the timeframe that will establish your reference candle.
- Display the previous closed candle's high and low.
- Move to your preferred lower timeframe.
- Monitor price interaction with the established range.
- Wait for your strategy's required confirmation.
- Define your stop-loss, position size and potential target before execution.
The objective is to keep the reference range visible while allowing price action to develop.
Ashinton Candle Levels Pro
A professional previous candle monitor indicator for MetaTrader 5.
The indicator automatically displays the highs and lows of previously closed candles from a selected reference timeframe directly on your active chart.
Key features include:
- Selectable reference timeframes from M1 to MN1.
- Display higher-timeframe candle levels on lower-timeframe charts.
- Monitor multiple historical candles.
- Automatic level updates when a new reference candle begins.
- Separate colour-coded high and low levels.
- An integrated dashboard displaying candle prices, timeframes and indicator status.
For traders exploring Candle Range Theory, this provides a convenient way to keep important candle boundaries visible while analysing price action.
https://www.mql5.com/en/market/product/206200




