Advanced Order Blocks (v1.88) — Complete User Manual & Playbook (Part 1)
Developed by - Algo Theory Studio
Welcome to the official manual for the Advanced Order Blocks indicator. Before diving into the technical mechanics, I highly recommend watching the full video breakdown to see the concepts in action.
📺 [Watch the Full Advanced OB Video Tutorial on YouTube]
🛒 [Get the FREE Advanced Order Blocks Indicator for MT5]
🛒 [Get the FREE Advanced Order Blocks Indicator for MT4]
➡️ [Already read this? Skip to Part 2: Settings & Trading Applications]
__________________________________________________________________________________________________________________________________________________________________________________
How to Navigate This Guide
This manual is an exhaustive, deep-dive reference. It is purposefully designed to serve a wide spectrum of users—from beginner traders grasping the basics of market structure, to advanced SMC analysts and MQL developers looking for strict algorithmic logic.
You do not need to read this cover-to-cover. If you are a beginner, do not get bogged down in the advanced technical parameters; jump straight to the Core Concepts and Trading Applications. Use the Table of Contents below to skip directly to the material relevant to your specific trading style.
Table of Contents
- Introduction
- Core Concepts
- Zone Types
- Order Block Lifecycle
- Breaker Blocks
- Rejection Blocks
- Liquidity Pools
- Visual & Labeling System
- Settings Reference
- Alerts
- How to Use / Trading Application
- Known Limitations / Notes
__________________________________________________________________________________________________________________________________________________________________________________
1. Introduction
1.1 What Is an Advanced Order Block?
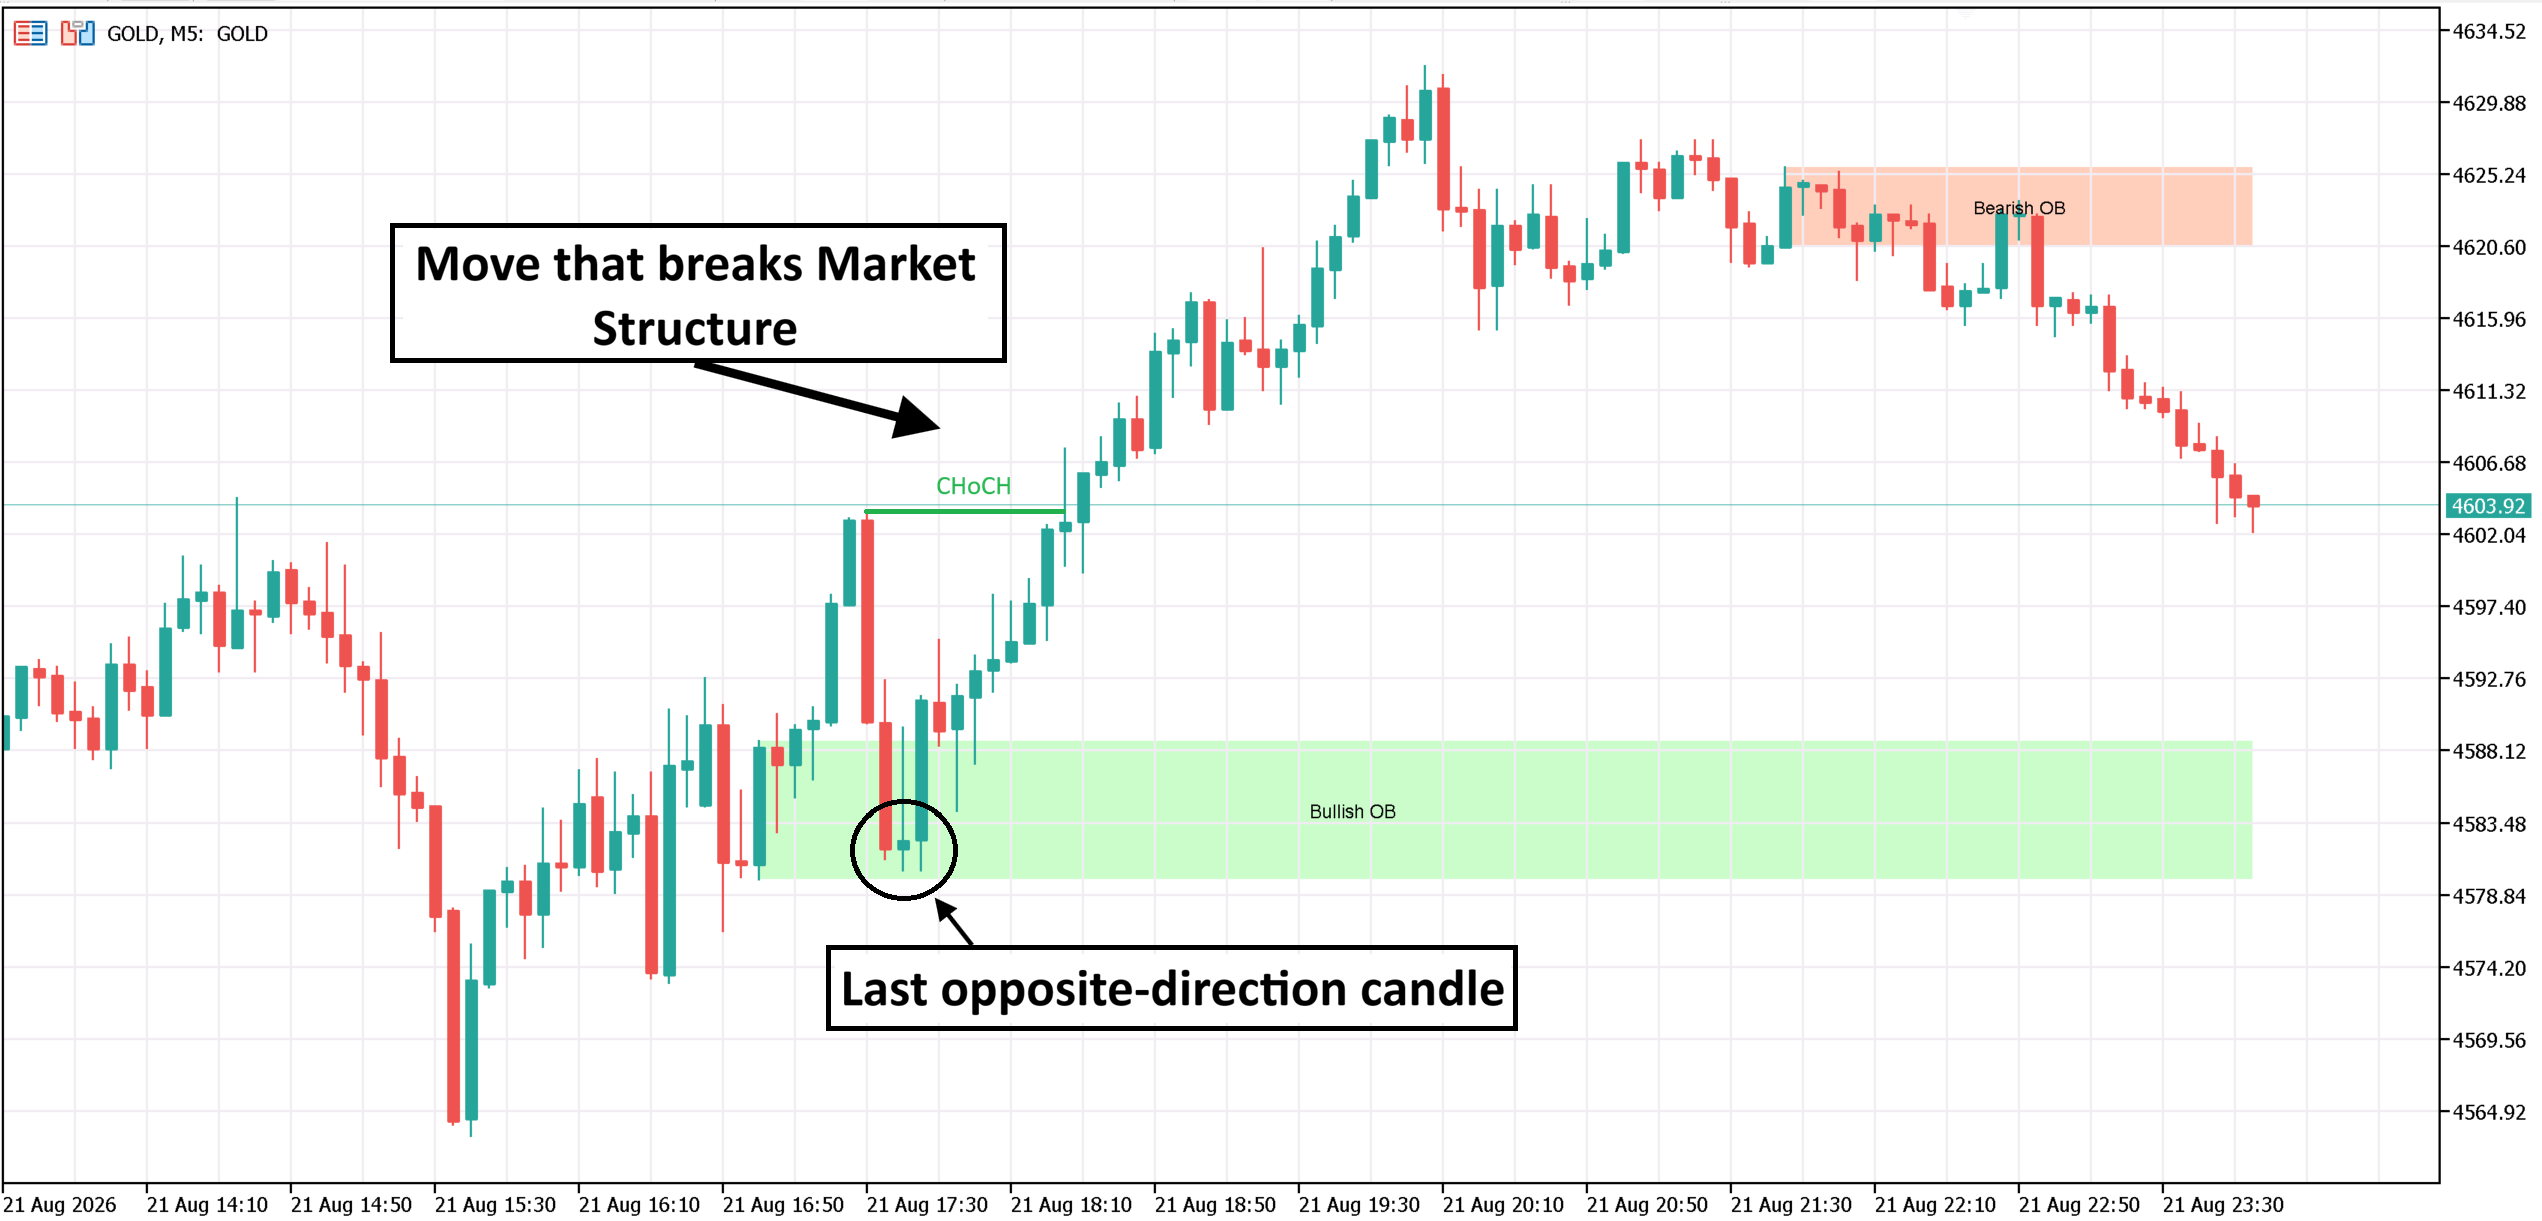
A basic order block is just: the last opposite-direction candle before a move that breaks structure. Most basic OB tools draw it once and leave it — either forever, or gone the moment price trades through it.
This indicator builds a full system around that same core idea:
- Volatility-filtered candle selection — abnormally large "spike" candles are skipped when picking the OB candle, so the zone isn't anchored to an outlier bar.
- A full lifecycle, not just on/off — every zone moves through defined states (Active → Mitigated → Invalidated → reborn as a Breaker) instead of just appearing and vanishing.
- Two extra zone types most basic OB tools don't have — Rejection Blocks (single-candle wick reversals) and Liquidity Pools (BSL/SSL with their own Swept/Flipped lifecycle).
- Two independent structure lenses running at once — Internal (minor/short-term) and Swing (major/long-term) — each producing its own complete set of zones, on the same chart timeframe.
- A tunable break-confirmation filter stack — minimum pivot age, minimum break distance, a wick-confluence filter, and a reversal-only body-ratio filter — instead of "any close or wick beyond the level counts."
1.2 What This Indicator Covers (Scope)
This indicator is focused entirely on Orders-flow zones: Order Blocks, Breaker Blocks, Rejection Blocks, and BuySide / SellSide Liquidity Pools.
It calculates Break of Structure (BOS) and Change of Character (CHoCH) internally — that's how it knows when to create a zone — but it does not draw BOS/CHoCH lines or labels on your chart. If you're running this alongside a broader SMC structure indicator, that's typically where you'd see BOS/CHoCH markers, premium/discount (equilibrium) zones, and similar structure tools.
Not included here: premium/discount zones, Fibonacci tools, or multi-timeframe overlays. Everything runs on the single timeframe your chart is set to — "Internal" is not a lower timeframe, it's a different lookback lens on the same candles (more on this in Part 2).
1.3 The No-Repaint Model
Every zone is built only from fully closed candles. A zone's boundaries — its high and low — are locked in the moment it's created and never move afterward. What does change over time is:
- Its right edge, which keeps extending to the current bar so it stays visible, and
- Its state and color, as it moves through its lifecycle (e.g. Active → Mitigated).
The price boundaries themselves never repaint. What you saw form on a closed candle is what stays there.
__________________________________________________________________________________________________________________________________________________________________________________
2. Core Concepts
2.1 Internal Structure vs Swing Structure
The indicator reads structure through two independent lenses, running side by side on the same chart timeframe:
| Internal | Swing | |
|---|---|---|
| Lookback (default) | 5 bars | 50 bars |
| Pivot frequency | Frequent — minor swings | Rare — major swings only |
| Typically suits | Shorter-term, more zones | Higher-conviction, fewer zones |
| Setting | Internal Structure Lookback | Swing Lookback Length |
Each lens produces its own pivot highs/lows, its own trend bias, and spawns its own separate Order Blocks, Breakers, and Liquidity Pools. This is not multi-timeframe — Internal doesn't mean a lower timeframe like M5 while Swing means H1. Both read the exact same candles on your current chart; they just use a different lookback window for confirming a pivot.
Note: to stop Internal structure firing a duplicate signal exactly on top of Swing structure, an Internal break only counts if the Internal pivot sits at a different price than the current Swing pivot. If the two haven't diverged yet, only Swing counts it.
2.2 How a Pivot Is Confirmed
A pivot high or low isn't confirmed the instant it happens — the market has to move away from it first. Using its lookback length (Internal or Swing), the indicator checks that no more extreme high/low has occurred within that window since the candidate bar. Once that holds, the bar is locked in as a confirmed pivot, and its price becomes the new reference level that price must break to cause a structure break.
Bigger lookback = the pivot takes longer to confirm, but carries more weight. Smaller lookback = confirms fast, but catches more minor, noisier swings.
2.3 BOS vs CHoCH — Reading Trend Bias
Every time a confirmed pivot gets broken, the indicator classifies the break as one of two things:
- BOS (Break of Structure) — price breaks a pivot in the direction of the current trend bias. Continuation.
- CHoCH (Change of Character) — price breaks a pivot against the current trend bias. Reversal — trend bias flips.
Both BOS and CHoCH spawn an Order Block; the indicator doesn't treat one as "more valid" than the other for zone creation. The difference is that a CHoCH, being a reversal call, can carry one extra confirmation filter that a BOS doesn't — see Part2.4.
*BOS and CHoCH is not drawn on your chart as a line or label (see Part 1.2) — they exist purely as internal logic that tracks trend bias and triggers zone creation.
Note: the very first break ever detected on a chart (before any trend bias exists yet) is always treated as BOS by default, since there's no prior trend to reverse.
2.4 What Confirms a Structure Break
Getting from "price is near a pivot" to "structure break confirmed, spawn a zone" runs through a stack of filters. All of them are optional/tunable:
-
Break Source — Close vs. High/Low. (Setting: Break Confirmation: Close | High/Low) Close requires a full candle close beyond the pivot — stricter, later, fewer false breaks. High/Low accepts a simple wick poke beyond it — faster, more signals, more noise from stop-hunt wicks.
Worth knowing: under Close-based confirmation, the break has to be caught on the exact candle where price flips from below the pivot to above it (or vice versa). If that one candle gets blocked by another filter below — say the pivot isn't old enough yet — the break can be missed entirely, since Close mode only ever checks that single transition candle. Price would need to pull back through the level and cross again for a fresh shot. High/Low mode doesn't have this issue, since it re-checks every bar independently.
-
Minimum Pivot Age. (Setting: Min Bars Before Pivot Can Be Broken) A pivot must sit for at least this many closed bars before it's allowed to break. Stops a freshly-formed, still-unstable pivot from being invalidated a bar or two after it appears.
-
Minimum Break Distance. (Setting: Min Break Distance, in ATR multiples) Even after price crosses the level, the close must clear it by at least this many ATR-multiples. Filters out marginal, barely-there breaks. Applies to both BOS and CHoCH.
-
Confluence Filter — Internal only. (Setting: Confluence Filter / Confluence Wick Ratio) An extra shape check on the breakout candle itself: for a bullish break, its upper wick must be meaningfully bigger than its lower wick, by your chosen ratio — the candle needs to show real directional push, not just a marginal close. This only affects Internal structure; Swing is never filtered by it.
-
CHoCH Body Ratio — reversals only. (Setting: Internal/Swing CHoCH Min Body-Close Ratio) Only applies when the break is a CHoCH. Requires the close to clear the pivot by at least a fraction of the candle's own body size — extra conviction demanded for a reversal, since reversals are the higher-risk call. BOS breaks skip this filter entirely.
__________________________________________________________________________________________________________________________________________________________________________________
3. Zone Types
A quick tour of what each zone means when you see it on the chart. (Full formation criteria and lifecycle rules for each are covered in Parts 4–7)
3.1 Order Blocks — Internal & Swing
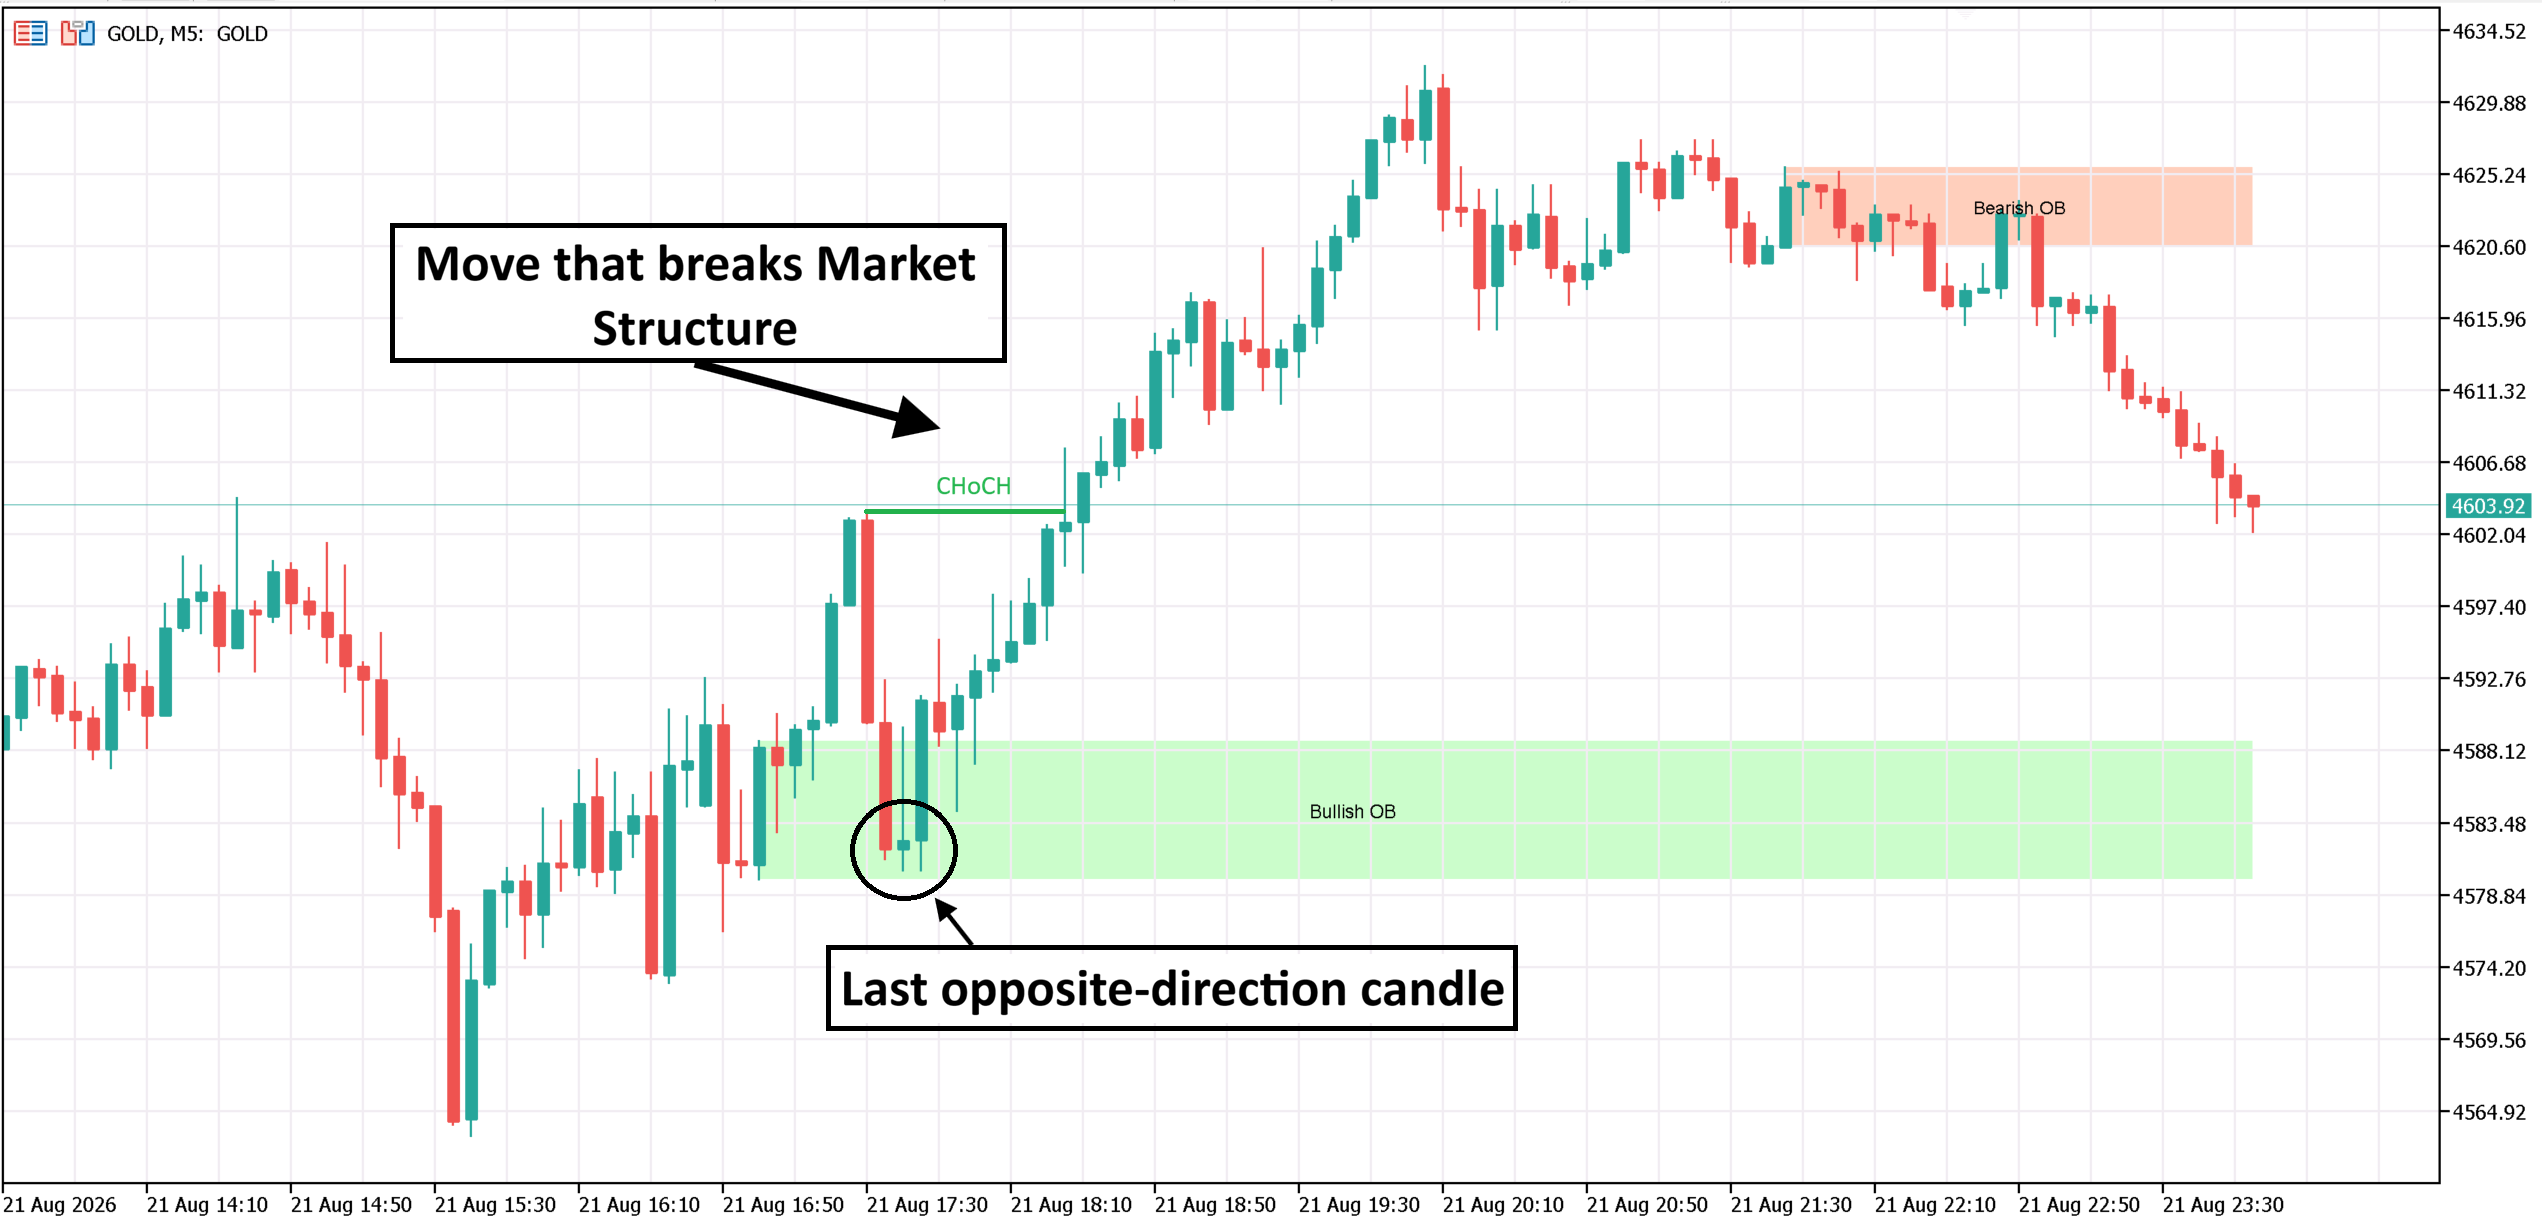
The last opposite-direction candle before a decisive move that broke structure (see Part 2.3–2.4). A Bullish OB marks the last down-candle before an up-move — a potential demand/support zone. A Bearish OB marks the last up-candle before a down-move — a potential supply/resistance zone.
Internal OBs come from Internal structure breaks; Swing OBs come from Swing structure breaks. Both run at the same time with fully independent settings — colors, max count on chart, and so on.
3.2 Mitigated Order Blocks
Once price trades back into an OB zone for the first time — touching its near side — without breaking all the way through it, the zone flips to Mitigated: same box, distinct styling, so you can tell at a glance it's already been "used" once. Still watchable, but no longer fresh.
3.3 Breaker Blocks
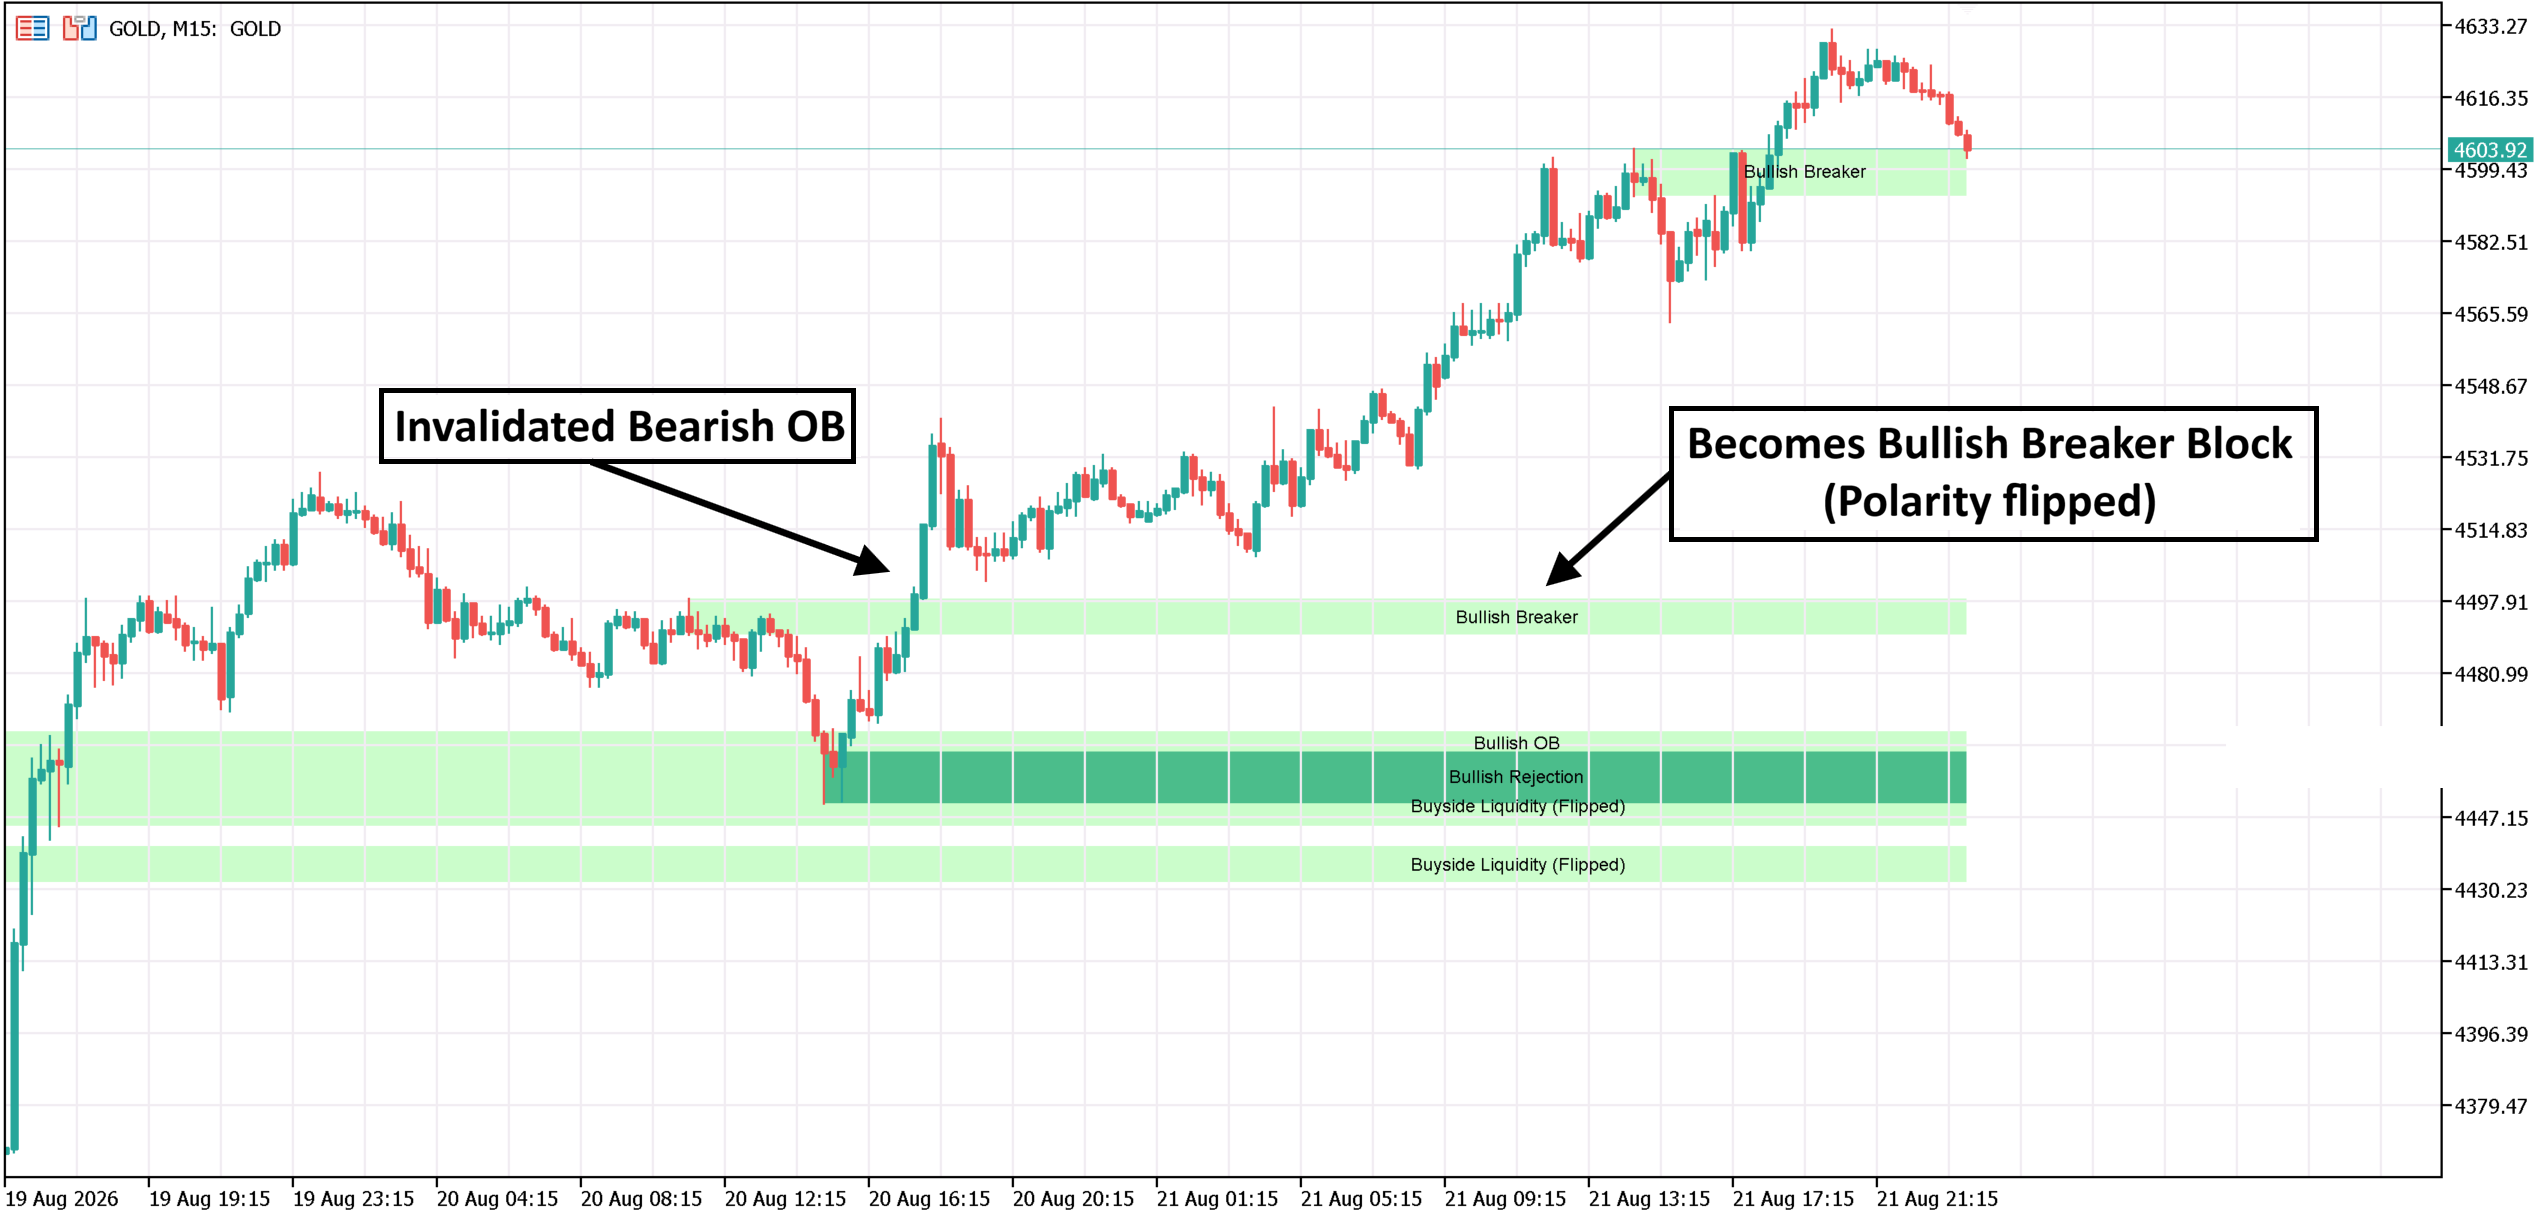
When an OB is fully broken through (price closes or wicks past its far side, depending on your mitigation setting), it doesn't just vanish — it's reborn as a Breaker Block with the opposite bias, same zone boundaries. A broken demand zone becomes a supply zone, and vice versa — the classic support/resistance polarity flip.
3.4 Rejection Blocks
A different formation logic entirely — not from a structure break, but from a single candle at a confirmed Swing pivot with a dominant rejection wick (price pushed one way, got rejected hard, closed back the other way). The zone drawn is just the wick portion of that candle, not the whole candle body. Rejection Blocks currently only run off Swing structure — there's no Internal version.
3.5 Liquidity Pools (BSL/SSL)
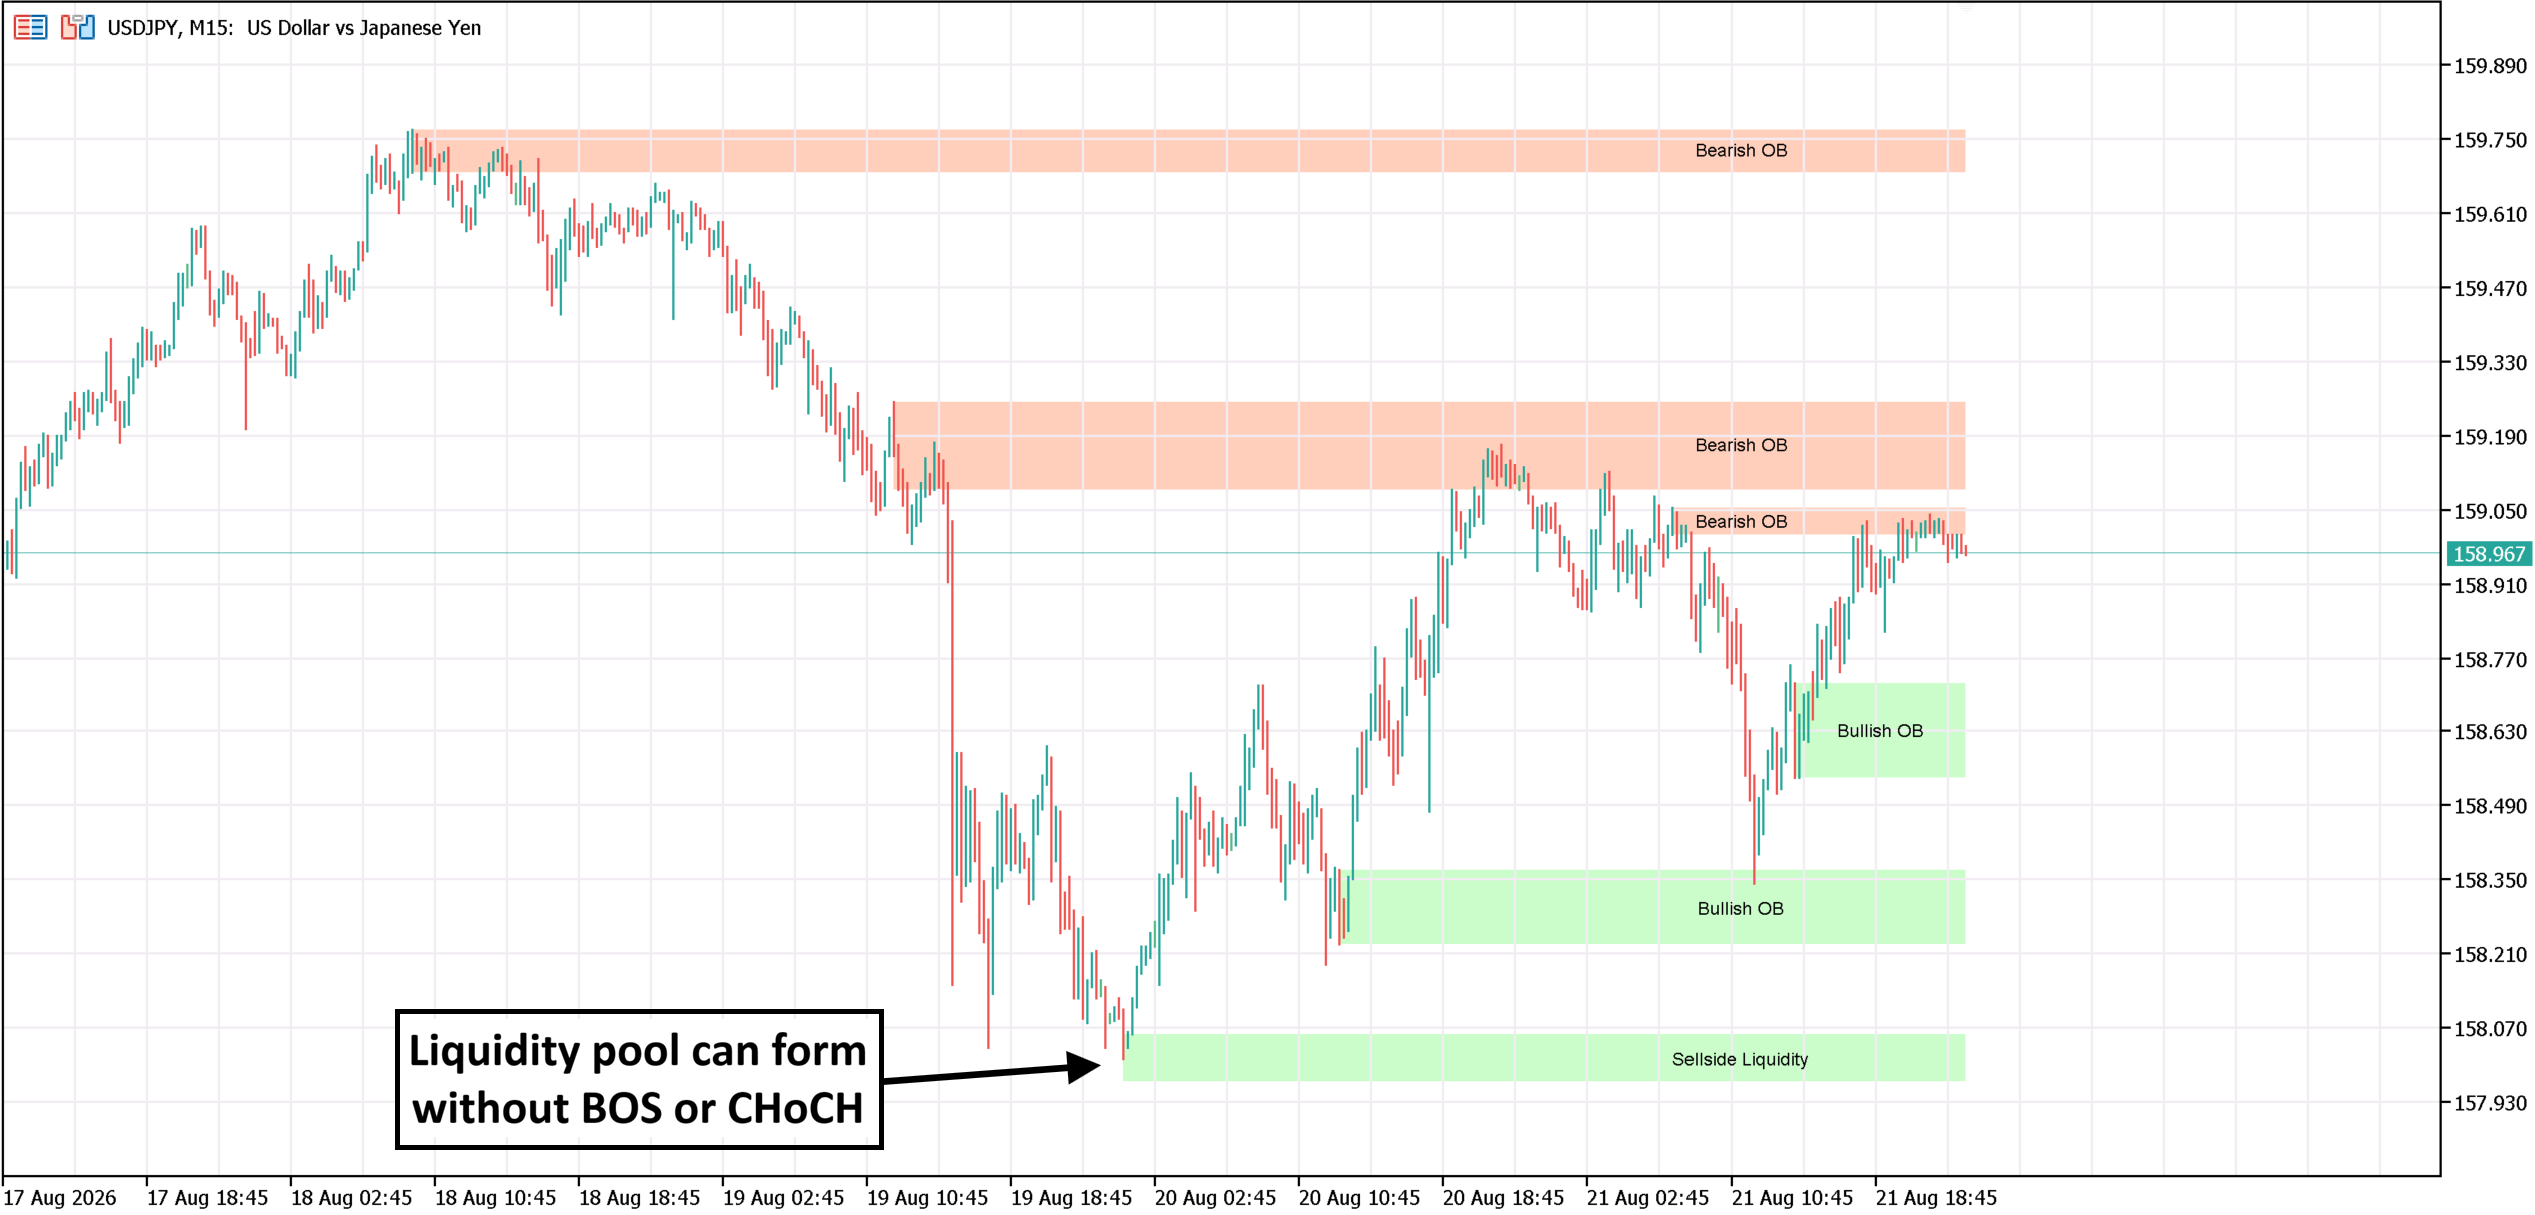
BSL (Buyside Liquidity) sits above pivot highs; SSL (Sellside Liquidity) sits below pivot lows — representing resting stop and breakout orders the market may be drawn toward before reversing. Unlike every other zone type here, a Liquidity Pool doesn't need a structure break to exist — it forms from every confirmed pivot, Internal or Swing, whether or not that pivot ever goes on to break structure. It runs its own lifecycle: Active → Swept (price ran through it) → Flipped (price then closed back through, turning it into a real support/resistance level) → removed.
At a Glance
| Zone | Forms From | Internal | Swing |
|---|---|---|---|
| Order Block | Structure break (BOS/CHoCH) | ✓ | ✓ |
| Mitigated OB | OB touched, not yet fully broken | ✓ | ✓ |
| Breaker Block | OB fully broken, bias flips | ✓ | ✓ |
| Rejection Block | Dominant wick at a pivot | — | ✓ |
| Liquidity Pool | Any confirmed pivot | ✓ | ✓ |
__________________________________________________________________________________________________________________________________________________________________________________
4. Order Block Lifecycle
4.1 Formation Criteria
An Order Block is spawned the instant a structure break is confirmed (see Part 2.3–2.4) — Internal breaks spawn Internal OBs, Swing breaks spawn Swing OBs, independently.
The OB candle itself is picked by scanning every candle between the pivot's origin bar and the bar right before the break, and taking the most extreme one — lowest low for a bullish OB, highest high for a bearish one. Before that scan runs, a volatility filter (see Part 4.4) first excludes any abnormally large "spike" candle from being eligible, so the zone doesn't end up anchored to a one-off outlier bar instead of a genuine opposing candle.
4.2 The Lifecycle: Active → Mitigated → Invalidated → Breaker
- Active — freshly formed, untouched.
- Mitigated — price has traded back into the zone (touched its near side) at least once, without yet clearing the far side. This state is tracked permanently the moment it happens, checked every bar.
- Invalidated — price fully clears the zone's far side. This isn't a state you'll see an OB "sit in" — the instant it happens, the OB is removed and, if Breaker Blocks are enabled, immediately reborn as a Breaker Block with the opposite bias at the same boundaries (see Part 5).
| State | Triggered by | Removed? | Visually distinct by default? |
|---|---|---|---|
| Active | OB just formed | No | — |
| Mitigated | Price touches near side | No, stays on chart | No — only if "Show Mitigated OBs" is on |
| Invalidated | Price clears far side | Yes — replaced by a Breaker (if enabled) | New Breaker color |
4.3 OB Mitigation Source (Close vs. High/Low)
One setting — OB Mitigation Source — decides what counts as "price reached this zone," and it's reused across three features at once: OB touch/break, Breaker re-break (see Part5.2), and Rejection Block break (see Part6.3). There's no separate source setting per zone type.
- High/Low (default): a wick reaching the zone is enough — more sensitive, zones get touched/broken sooner.
- Close: the candle must close inside (or through) the zone — stricter, later confirmation, fewer false touches from long wicks.
4.4 The Volatility Filter — Choosing the OB Candle
Every closed candle is checked: is its high-to-low range at least High-Vol Bar ATR Multiplier times the current volatility measure? If yes, that candle is flagged as an outlier for OB-selection purposes only — it doesn't block or delay any structure break, it simply removes itself from contention when the indicator picks the "most extreme candle" for a new OB.
Two ways to measure that volatility (OB Volatility Filter setting):
- ATR (default): a fixed 200-period ATR — the same ATR figure used everywhere else in this indicator that references "ATR multiples" (break distance, rejection wick size, liquidity pool tolerance and thickness — all one number).
- Range: the average true range across every candle since the indicator started calculating — not a recent rolling window, but an expanding all-history average. It settles down and grows steadily less reactive to recent volatility the longer your chart's history runs, which is worth factoring in if you're comparing this setting's behavior across symbols with very different amounts of loaded history.
__________________________________________________________________________________________________________________________________________________________________________________
5. Breaker Blocks
5.1 How an OB Flips Into a Breaker
The moment an OB is Invalidated (see Part4.2), a Breaker Block is created — if Show Breaker Blocks is on — at the exact same high/low boundaries as the OB that just died, bias flipped: a bullish OB becomes a bearish Breaker, a bearish OB becomes a bullish Breaker. It's labeled "Bullish Breaker" / "Bearish Breaker" on chart.
Internal OBs produce Internal Breakers and Swing OBs produce Swing Breakers, tracked and counted separately. Unlike Order Blocks, a Breaker has no Mitigated in-between stage — it's simply on the chart, or it isn't.
5.2 Re-Break / Removal Rule
Remove Breaker When Re-Broken (default on): if price closes or wicks back through the Breaker's own far side — resuming in the original, pre-flip direction — the Breaker is deleted outright, using the same Mitigation Source setting from Part4.3. There's no second flip; a re-broken Breaker doesn't turn back into an Order Block.
Turn this off and re-breaking no longer removes a Breaker — at that point, age (see part5.3) is the only way it leaves the chart.
5.3 Max Age / Width Expiry
Max Breaker Width (bars, 0=disabled) — despite the name, this is measured in bars elapsed since the Breaker's origin candle, i.e. its age. Since every active zone's right edge keeps stretching out to the current bar (see Part1.3), "age in bars" and "width in bars" are the same growing rectangle described two ways — one setting, not two separate limits.
*Set it to 0 to disable entirely. By switching "max age" and the "re-break" rule off, a Breaker can persist indefinitely. Applies identically to Internal and Swing Breakers.
__________________________________________________________________________________________________________________________________________________________________________________
6. Rejection Blocks
6.1 Formation Criteria
Rejection Blocks form only from Swing pivots — there's no Internal version, and no setting to add one. Unlike an Order Block, a Rejection Block doesn't need a structure break at all — only a confirmed Swing pivot (see Part2.2) whose candle shows a dominant rejection wick. Two conditions must both hold on that pivot's own candle:
- Min Wick Size (ATR multiples): the relevant wick — upper wick at a pivot high, lower wick at a pivot low — must be at least this many multiples of the same 200-period ATR used throughout the indicator.
- Min Wick-to-Opposite-Wick Ratio: that wick must also be bigger than the wick on the other side of the candle by at least this ratio.
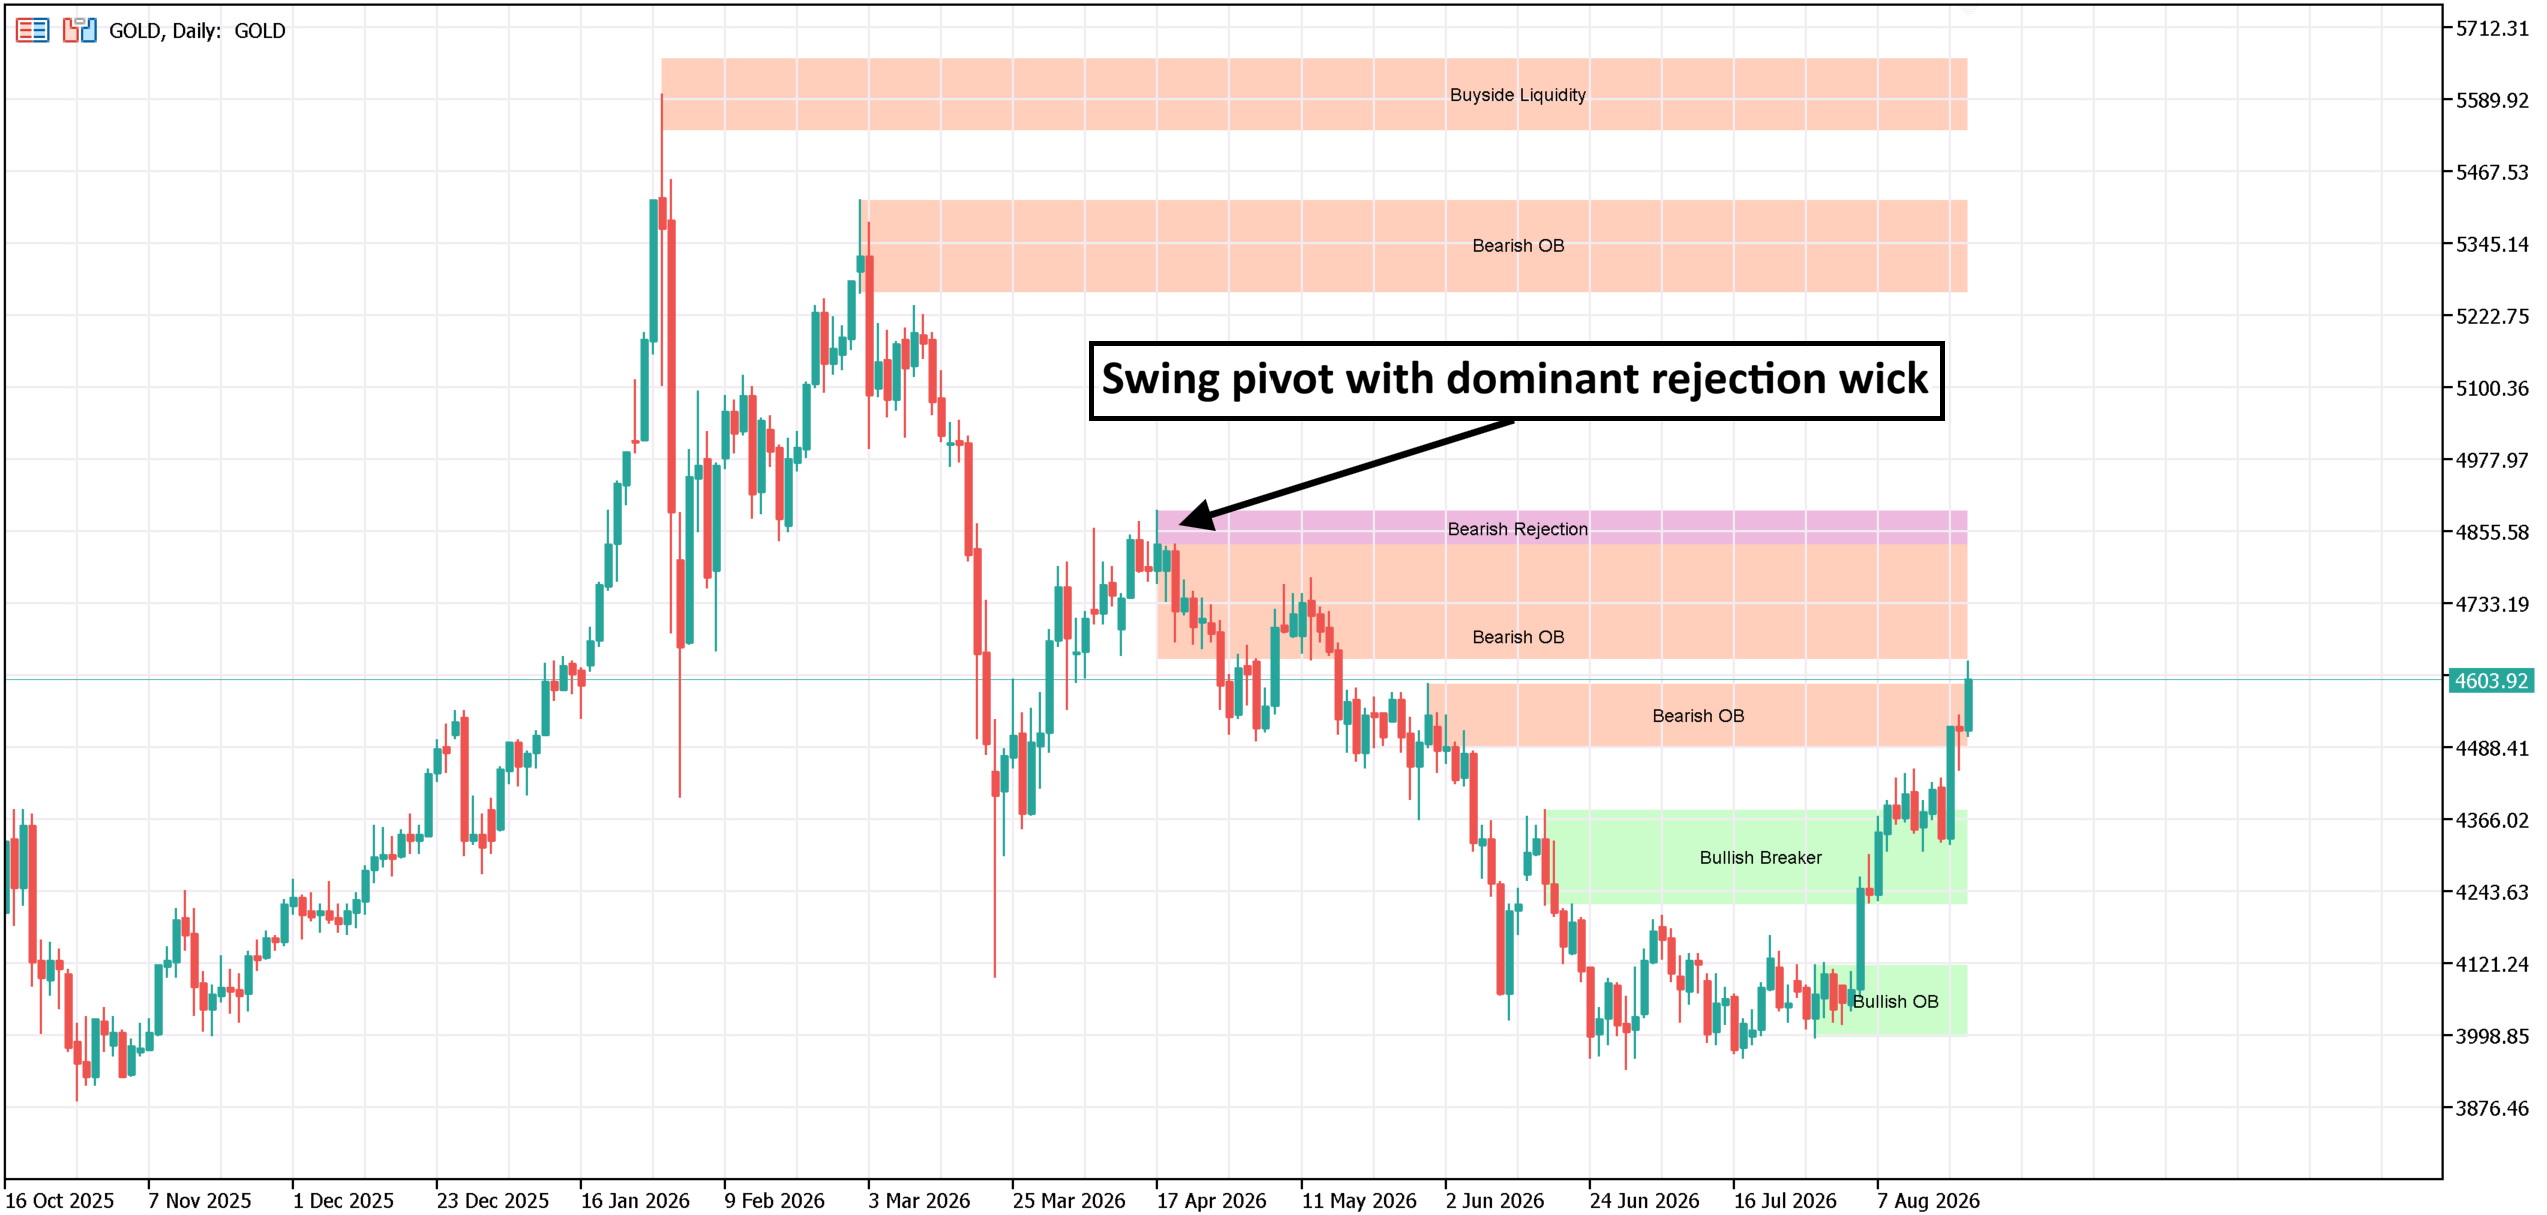
Both must pass together — a large wick on a candle with an almost-as-large opposing wick won't qualify. The zone itself is drawn as just the wick — from the extreme (high or low) to the near edge of the candle's body — not the full candle.
6.2 Trend Alignment Filter
Require Alignment With Swing Trend Bias (default on): a Rejection Block is only kept if it agrees with the current Swing trend bias (see Part2.3) — a bullish Rejection Block is discarded outright if Swing trend bias is currently bearish, and vice versa. Switch it off to let counter-trend rejection signals through too.
6.3 Removal — No Age-Based Expiry
A Rejection Block is removed only when price fully clears the far side of its wick zone — same Mitigation Source setting as everywhere else (see Part4.3).
| Order Block | Breaker Block | Rejection Block | |
|---|---|---|---|
| Needs a structure break | Yes | Yes (inherits from parent OB) | No — just a qualifying pivot |
| Sub-states tracked | Active, Mitigated | None | None |
| Leaves the chart via | Full break → becomes a Breaker | Re-break (optional) or max age | Full break only |
| Age-based expiry | — | Yes | — |
| Internal version | Yes | Yes | No — Swing only |
| Also capped by | Max Count setting | Max Count setting | Max Count setting |
__________________________________________________________________________________________________________________________________________________________________________________
7. Liquidity Pools
7.1 What Counts as BSL/SSL
BSL (Buyside Liquidity) forms at every confirmed pivot high; SSL (Sellside Liquidity) forms at every confirmed pivot low — Internal and Swing each tracked independently (Show Internal/Swing Liquidity Pools). Independent of BOS/CHoCH: a pivot becomes a pool regardless of whether it ever goes on to break structure.
Each pool draws as a thin horizontal band centered on the pivot price, not a single line — total thickness = Zone Thickness (ATR multiples) × the indicator's 200-period ATR, split evenly above and below the price.
7.2 Equal Highs/Lows Merging
Equal High/Low Merge Tolerance (ATR multiples): if a new confirmed pivot lands within this tolerance of an existing, still-Active pool of the same type (BSL only merges with BSL, SSL only with SSL, never across), the two merge into one pool rather than sitting side by side. On merge, price snaps to whichever is more extreme — the higher of the two for BSL, the lower for SSL — so a level can creep outward slightly as more equal highs/lows feed into it.
Each merge increments a touch count, which drives the "(x2)", "(x3)" label suffix (Append Equal-Pivot Count To Label) — a quick visual cue for a level that's been tested repeatedly.
7.3 Lifecycle: Active → Swept → Flipped → Removed
- Active → Swept: price trades through the pool's exact price level (source configurable — see Part7.4).
- Swept → Flipped: a candle closes beyond the far edge of the band (price ± half the zone thickness) — not merely the pivot line, and not just closing somewhere inside the band. Always close-based regardless of the sweep-source setting (see Part7.4): a flip needs a decisive confirmed break, not a wick.
- Swept → Removed: no flip within "Swept Pool Max Age Before Flip" bars.
- Flipped → Removed: either price closes back through the whole band the other way (re-broken), or the pool exceeds "Flipped Zone Max Age" bars.
Worth knowing: Active can jump straight to Flipped in a single bar. If one candle both sweeps the level and closes beyond the band's far edge, both transitions fire together — Swept isn't guaranteed to be a separate, visible step you'll always see happen first.
7.4 Sweep Source vs. Flip Confirmation
LP Sweep Source: Close | High/Low controls only the Active→Swept transition — High/Low (a wick touch) is more sensitive, Close is stricter. The Swept→Flipped transition is always close-based no matter what this is set to; it's the one step in the lifecycle this setting doesn't reach.
7.5 Max Age Rules — and a Display Gotcha
Two independent age counters, each measured from the moment a pool entered its current state (and reset on every state change): Swept Pool Max Age Before Flip, and Flipped Zone Max Age. Set either to 0 to disable that expiry.
Show Swept/Flipped Liquidity Pools (default on): turn it off and a pool is deleted the instant it leaves Active state — Swept or Flipped — meaning you'd never see the Swept or Flipped recoloring at all; it just vanishes the moment it's touched.
Contrast with Part 4.2: "Show Mitigated OBs" defaults off and, when off, keeps the zone visible without the distinct color. This setting defaults on, and turning it off deletes the zone outright instead of hiding a color change. Same-shaped toggle, opposite default, opposite effect — worth not assuming one behaves like the other.
7.6 Priority vs. Order Blocks, Breakers, and Rejection Blocks
Each redraw pass draws in a fixed order: Order Blocks → Breakers → Rejection Blocks → Liquidity Pools. Every Order Block, Breaker, and Rejection Block that successfully draws "claims" its price range. Any Liquidity Pool band that would fall inside a claimed range is skipped — not drawn, and deleted if it was showing a moment ago — since those three zone types take visual priority over an unflipped pool.
*Exception: a Flipped pool is exempt. Once flipped, it's treated as a genuine structural support/resistance level and is always shown, overlap or not.
__________________________________________________________________________________________________________________________________________________________________________________
8. Visual & Labeling System
8.1 Zone Opacity & Color Blending
Zone Opacity % (0=invisible, 100=solid) is the general setting behind almost every zone — with two state-specific overrides: Mitigated OBs use their own Mitigated Zone Opacity %, and Swept Liquidity Pools use their own Swept Zone Opacity %. Everything else — Active OBs, Breakers, Rejection Blocks, Active and Flipped Liquidity Pools — follows the one general setting.
This isn't true transparency: each zone's color is mathematically blended toward your chart's background color by the opacity percentage, not rendered with an alpha channel. 100% = pure zone color, 0% = pure background color. Practically, this means the blend is calculated against the background color the indicator last saw — if you change your chart's background afterward, the blend catches up on the next recalculation rather than instantly.
8.2 Light vs. Dark Color Mode
Color Mode: Light | Dark is not a general brightness inversion — it's a small, fixed lookup table covering exactly four default colors: PaleGreen→Lime, LightSalmon→Red, Teal→DarkGreen, Crimson→Brown. Any other color, including any custom color you've picked yourself, is left completely untouched.
Worth knowing: if you've already customized your zone colors away from the defaults, switching to Dark Mode will visibly do nothing, since none of your custom colors are in that lookup table.
It applies uniformly to Order Blocks, Breakers, Rejection Blocks, and Liquidity Pools (including Flipped LP colors) — with one exception: Mitigated OB colors are always used exactly as set and never remapped.
8.3 Colored vs. Monochrome Style
Style: Colored | Monochrome swaps every zone's individual color choice for one of two fixed shades — a lighter and a darker gray — ignoring your custom color inputs entirely while Monochrome is on. Which of the two shades is used still distinguishes zone side/type, and a Flipped Liquidity Pool swaps to the opposite shade the instant it flips, so the flip stays visible even in Monochrome.
8.4 Label Behavior
Horizontal position — midline vs. fixed offset. A young zone's label sits at its own midline, centered between its origin bar and the current bar, drifting right with the zone as it widens. Once a zone's age passes "Use Midline Label While Zone Age <= This" (bars), its label switches instead to "Label Offset From Latest Bar" (bars) — the same fixed distance back from the current bar for every aged zone. In practice: young zones each carry a label centered in their own box, while every older zone's label lines up together at one shared point near current price, drifting right in lockstep as new bars form.
Same-text labels merge. If two or more zones would show identical label text (e.g. two "Bullish OB" zones) and their price ranges overlap, only one label is drawn, positioned at the vertical midpoint of their combined range — the other zones keep their boxes but lose their own label. The most recently formed zone in that group is the one whose label survives.
Order Block labels yield to Rejection Block labels. If a surviving OB label's zone overlaps a Rejection Block's zone, the OB label is pushed off-center toward its own zone's edge (top for Bullish, bottom for Bearish) rather than sitting dead-center, freeing the middle for the Rejection label, which is never moved.
(This is a separate system from the box-merging in Part8.5 — one merges same-text labels, the other merges same-color boxes. They run independently.)
8.5 Zone Overlap Handling — No "Hole" Bug
When a new zone's price range overlaps an already-drawn zone that would render in the exact same final color (after opacity blending), the indicator doesn't stack a second rectangle on top of the first — it merges the two into one box spanning the earliest start time and the outer (union) high/low of both. This avoids the visible seam or z-order glitch you'd otherwise get from two overlapping semi-transparent rectangles of identical color. Applies across Order Blocks, Breakers, and Rejection Blocks alike.
Practical note: every zone object is non-selectable and hidden from the chart's object list by design — you won't accidentally click, drag, or delete one directly on the chart.
__________________________________________________________________________________________________________________________________________________________________________________
To keep this guide organized and work within MQL5's formatting limits, the technical configurations and actual trading strategies are detailed in the next blog.
Next Steps & Resources
➡️ [Continue to Part 2: Settings, Alerts, and Trading Applications]
📥 [Advanced Order Blocks for MetaTrader 5]
📥 [Advanced Order Blocks for MetaTrader 4]
This is a 100% free, advanced tool developed to give back to the trading community. If this indicator and manual add value to your analysis, two quick actions make a massive difference:
⭐️ [Leave an Honest Review on MQL5] — High ratings keep this project visible and free for everyone.
📺 [Subscribe to Algo Theory Studio on YouTube] — For full video breakdowns, strategy guides, and visual walkthroughs.
💬 Support & Feedback
-
Bug Reports & Technical Issues: Send a Direct / Private Message (PM) on MQL5 with a description of the issue and relevant chart screenshots — messaging directly ensures issues are diagnosed and fixed quickly in official updates.
-
Feature Ideas? Drop your suggestions in the comment section or send a private message. Community input actively drives future indicator enhancements.
Trade with precision and strictly manage your risk.