A smooth equity curve, a high profit factor, and a small drawdown are exactly what most traders want to see in an EA.
There is nothing wrong with that. A strategy with a genuine edge should produce attractive historical results.
But a good backtest should lead to one more question:
Did the strategy capture something durable about the market, or was it gradually shaped around the same history used to evaluate it?
A finished equity curve shows the result. It does not show the development path that produced it.
The feedback loop that can make a backtest look better
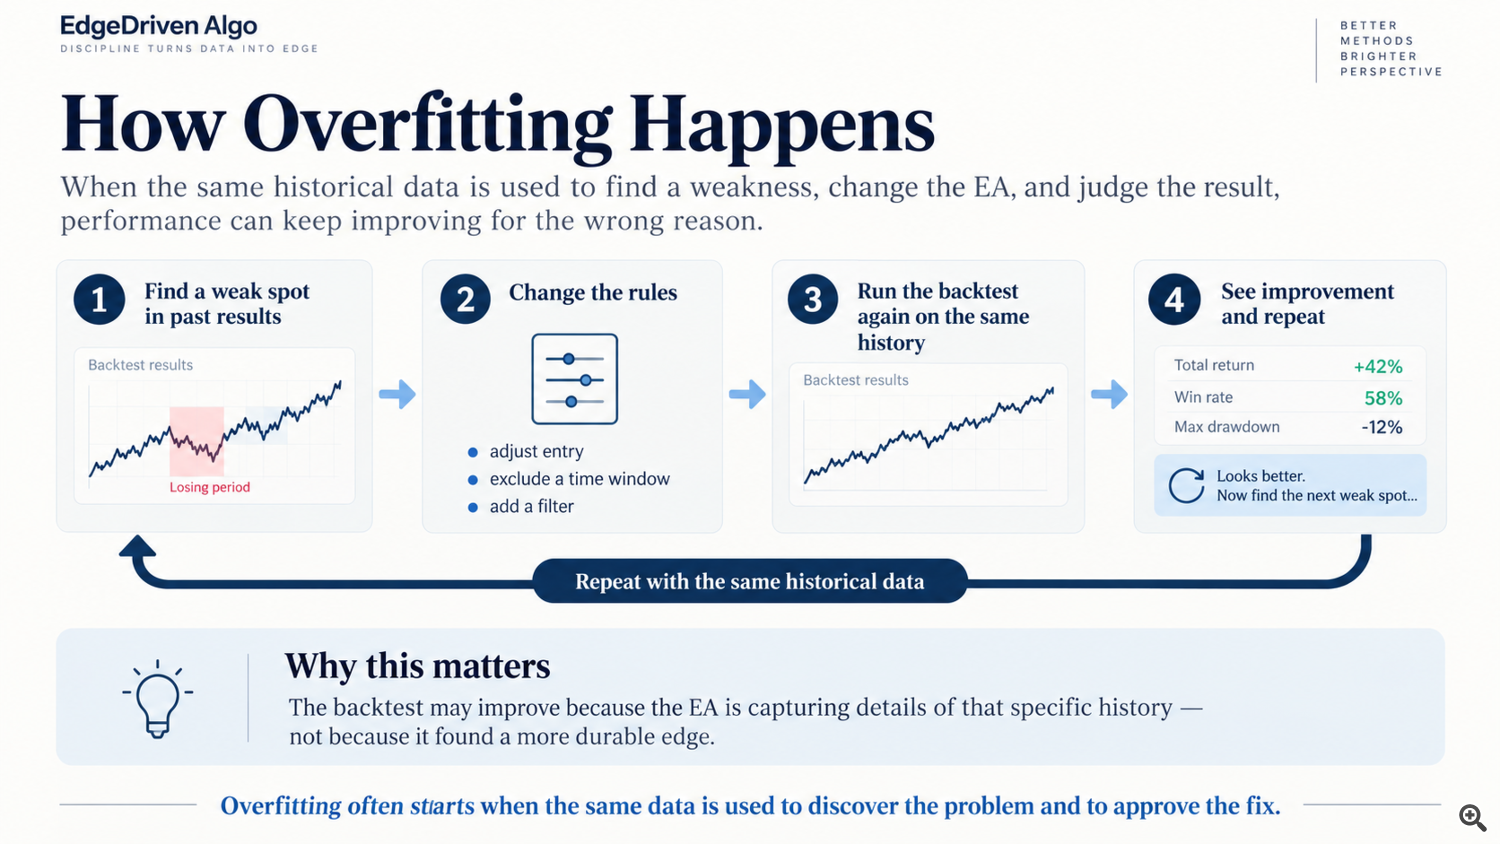
Imagine an EA that performs poorly during a particular time of day.
You identify the weak period, change the rules to avoid it, and run the backtest again. The result improves.
Then you notice one weekday has been especially weak, so you remove it. The result improves again.
Next, a new filter removes another cluster of losing trades.
Each change may have a reasonable explanation. Trial and error is part of research.
The problem is that the same historical sample is being used to find the weakness and to approve the fix.
After enough repetitions, the strategy can become increasingly well adapted to that specific history. The backtest improves, but it becomes harder to know whether the improvement represents a durable edge or simply a better fit to the past.
Overfitting is not only about parameters
Over-optimization is often described as searching for the perfect indicator value or parameter set.
That is only one form of it.
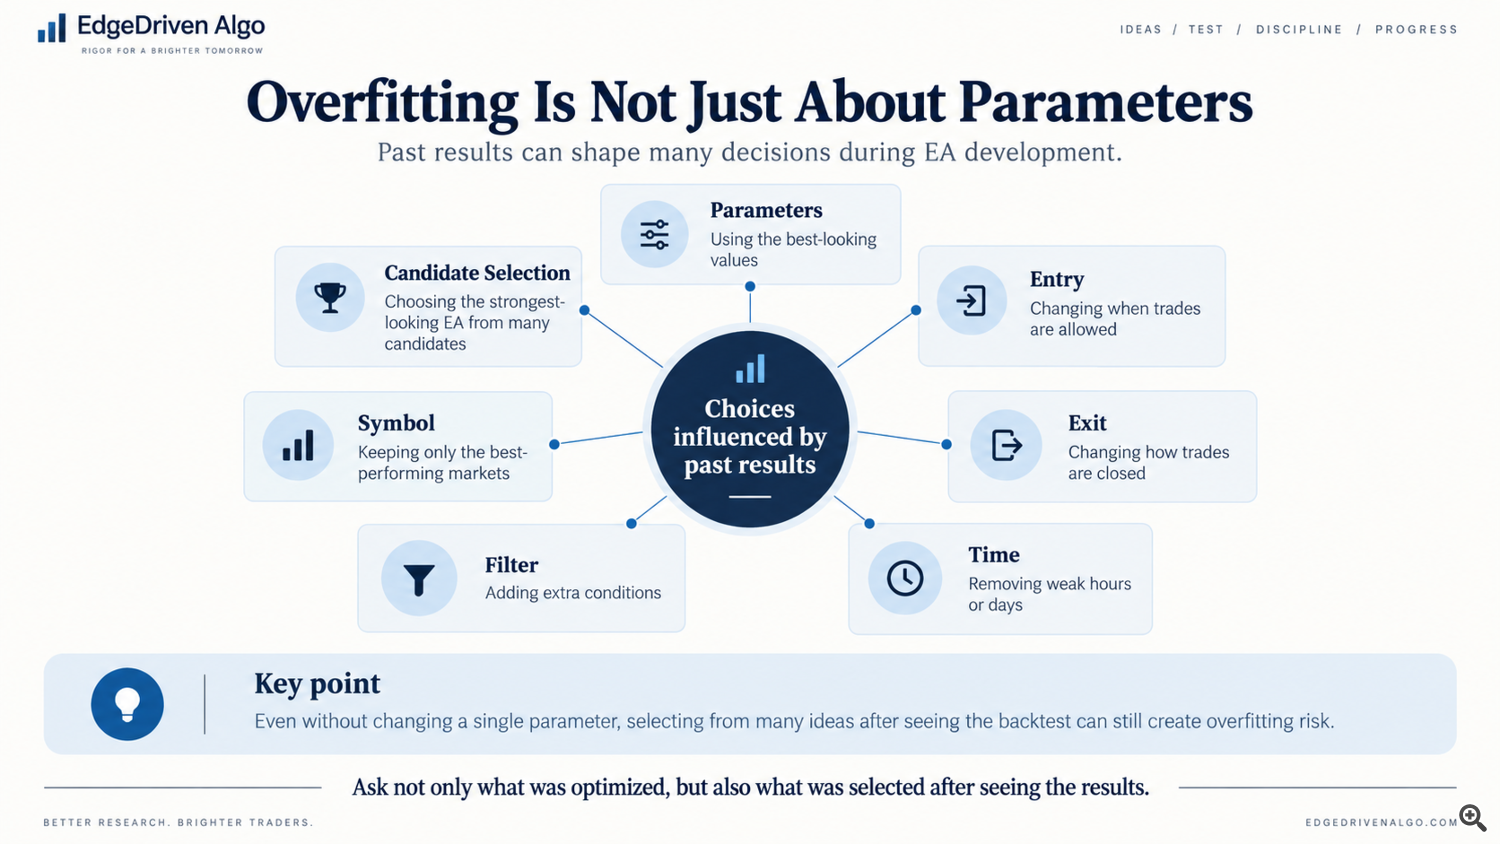
Historical results can influence many decisions:
- entry rules,
- exit rules,
- trading hours,
- filters,
- symbols,
- and which EA is selected from a larger pool of candidates.
The last point is easy to underestimate.
Suppose you generate 100 EAs and keep the one with the highest historical PF.
You may not have changed a single parameter in the final EA. But the selection itself used information from the backtest.
With a larger candidate pool, there is also a greater chance of finding a strategy that happened to fit that particular historical period unusually well.
So the useful question is not only:
How many parameters were optimized?
It is also:
How many development decisions were made after looking at the historical results?
The final curve is useful, but incomplete
A product page usually shows the finished backtest.
You can see PF, drawdown, win rate, and the equity curve.
What you cannot see from those numbers alone is:
- how many ideas were tested,
- how many filters were compared,
- how many markets were considered,
- how many candidates were screened,
- or what changed after weak results appeared.
This does not mean extensive research is bad. EA development requires experimentation.
The important point is to separate two jobs:
building the strategy
and
challenging the strategy after it has been built
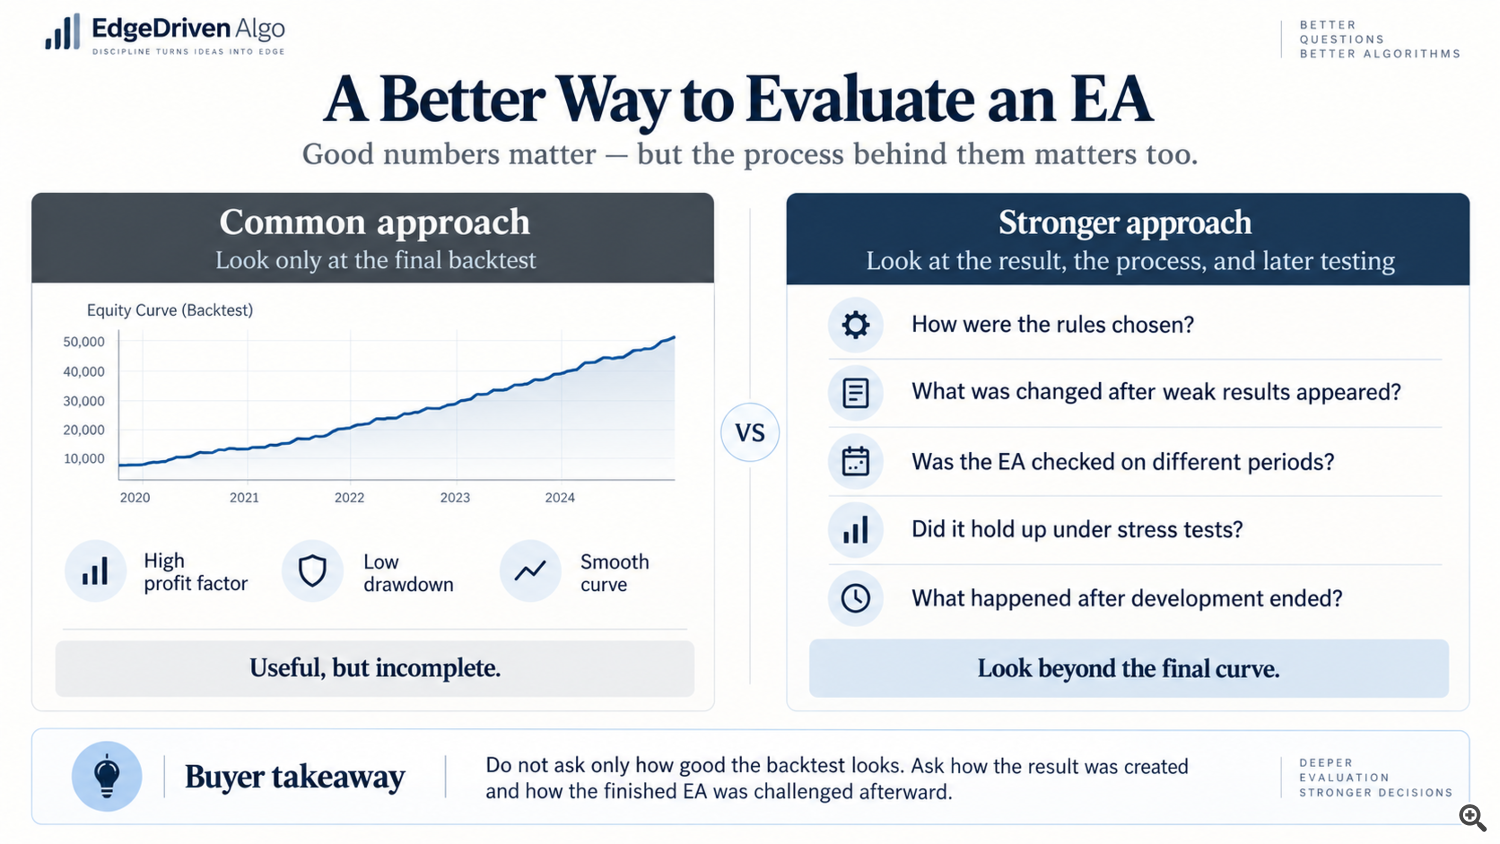
Once the backtest looks good, useful follow-up questions include:
- Does the logic still work on a different period?
- Does performance collapse if the settings move slightly?
- Does the edge survive worse spreads or trading costs?
- What happens to drawdown if the trade sequence changes?
Out-of-sample testing, parameter variation, cost stress, and Monte Carlo analysis do not predict the future. Their role is to reveal weaknesses that one attractive backtest may hide.
Good numbers still matter
A high PF is not automatically suspicious.
A small drawdown is not proof of overfitting.
A smooth equity curve is not a reason to reject an EA.
Strong historical performance is exactly what we hope to see from a strategy with a genuine edge.
The distinction is simply this:
Good numbers are useful evidence, but they are not proof of robustness on their own.
When a backtest looks impressive, I add two questions:
1. What historical information was used to create this result?
2. After those choices were finished, how did the EA behave on data or conditions that were not used in the same way?
The first question is about how the backtest was created.
The second is about how the finished EA was challenged afterward.
That distinction is one of the simplest ways to look beyond an attractive equity curve.
EdgeDriven Algo products on MQL5
The same evidence-first principles are applied to our fixed portfolio EAs:
EdgeDriven Gold Portfolio — XAUUSD
https://www.mql5.com/en/market/product/194762
EdgeDriven Dollar Yen Portfolio — USDJPY
https://www.mql5.com/en/market/product/194970
EdgeDriven Algo — Edge, Backed by Evidence.
Historical simulations do not guarantee future results. Leveraged trading can cause substantial losses.