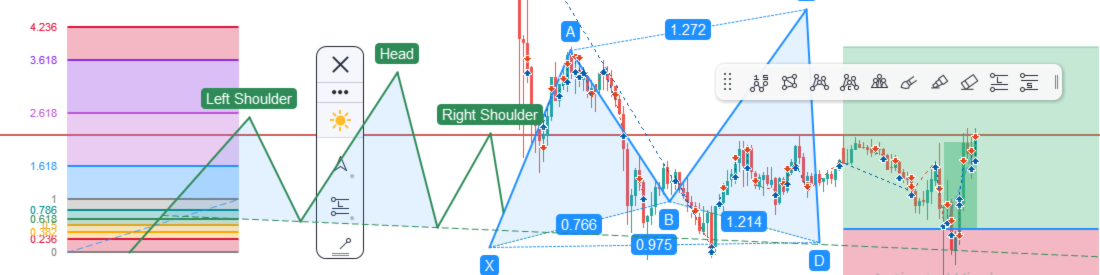
Chart Drawing Toolkit: A Complete Manual-Analysis Workspace for MetaTrader 5

In the fast-moving world of forex trading, the charts we read are only as good as the tools we use to mark them up. Trendlines, channels, Fibonacci levels, and clean annotations are how a trader turns raw price action into a plan. Yet on most platforms these manual tools are scattered across menus, fiddly to configure, and slow to reach in the very moment that matters. That is exactly the problem the Chart Drawing Toolkit was built to solve. In this post we will walk through what the toolkit brings to MetaTrader 5 and how it fits into a trader's everyday workflow.

The Chart Drawing Toolkit is a complete drawing and chart-analysis workspace for MetaTrader 5. It gathers more than forty drawing and markup tools into one clean panel that docks to the edge of your chart, so every manual analysis tool you need is a single click away. Because it runs as an indicator, it sits comfortably alongside your Expert Advisors and other indicators on the same chart, adding a full analysis layer without taking over your terminal. It draws and annotates only; it never places trades, so it stays out of the way of whatever strategy you are running.
Before we go deeper, here is where you can find the toolkit on the Market.
View the Chart Drawing Toolkit
At its core, the toolkit combines four pieces that work together. A docking sidebar snaps to the left or right edge of the chart and scrolls when your list grows. A quick tool flyout opens each category and sizes itself to its own contents. A live properties bar lets you adjust the selected object's color, line width, style, opacity, font, and alignment on the fly. And a settings window with Style, Text, and Coordinates tabs gives you precise control, right down to exact price and time coordinates. Add a pinned tools bar for one-click access to your favorites, plus dark and light themes, and you have a workspace that adapts to how you actually trade rather than forcing you into a fixed layout.

The tool set itself is broad enough to cover almost any style of manual analysis. There are line tools for mapping structure, including the trendline, horizontal and vertical lines, ray, extended line, info line, angle line, and cross line. There are channels for tracking momentum, with the parallel channel, regression trend, and standard deviation trend. Traders who study geometry get full pitchfork and Gann families, from the Andrews, Schiff, and modified Schiff pitchforks to the Gann line, fan, and box.

Fibonacci fans are served just as well, with retracement, expansion, time zones, channel, and speed-resistance arcs and fan. Round it out with shapes such as the rectangle, rotated rectangle, triangle, ellipse, circle, arc, curve, and path, a complete annotation set of text, note, price note, callout, comment, and a family of arrows, and a precision crosshair with a magnifier lens and a measure tool that reads price and time distance, and you have a genuinely complete markup kit.

One thing we cared about deeply while building the toolkit is that all of this stays smooth and sharp. A drawing panel is only useful if it never fights you, so a great deal of work went into keeping the rendering fast and flicker-free as you resize, zoom, and scroll, and into keeping every object crisp at any chart scale and any screen resolution. Lines, curves, and text are all drawn through one consistent, high-resolution, anti-aliased pipeline, which means a Fibonacci level, a channel readout, and your own text on a trendline all share the same clean, uniform look.

Using it in practice is refreshingly direct. Attach the toolkit to any chart, on any symbol and timeframe. Click a category in the sidebar to open its tools, pick one, and draw. Click any object to edit it in the properties bar, or open the settings window when you want full control over style, text, and exact coordinates. Pin the tools you reach for most, switch the theme to match your chart, and dock the panel on whichever side suits you. Everything is where you expect it, and nothing gets in your way.

In short, the Chart Drawing Toolkit turns the scattered, slow business of manual chart markup into a single fast workspace. More than forty professional tools, a clean docking panel, precise per-object control, and rendering that stays crisp and smooth, all working alongside the rest of your setup. Whether you map structure, project targets, study geometry, or simply annotate your ideas, the toolkit gives you a faster, cleaner way to think on your charts.
Cheers to many more coming our way!



