
WAVE FIBONACCI

MQL5 Blogs : https://www.mql5.com/en/blogs/post/771791
MT4 Version : https://www.mql5.com/en/market/product/182305
MT5 Version : https://www.mql5.com/en/market/product/182306
WAVE FIBONACCI [tambangEA] is a professional market-structure and Fibonacci wave analysis indicator designed for traders who want to read bullish and bearish price projections directly from the chart.
The indicator combines wave structure, Fibonacci projection zones, target levels, swing points, and a practical dashboard panel with multi-symbol navigation. It is designed to help traders identify potential reaction areas, continuation targets, and price structure direction without manually drawing every level.
This is a visual analysis tool, not an Expert Advisor. It does not open, close, or modify trades automatically.
Main Concept
WAVE FIBONACCI [tambangEA] analyzes market movement through bullish and bearish wave formations.
The indicator displays:
- Red projection zones for bearish or sell-side wave targets.
- Green projection zones for bullish or buy-side wave targets.
- Wave swing markers based on price structure.
- Fibonacci target levels and extension areas.
- Directional visual filtering through dashboard buttons.
- Multi-pair symbol buttons for quick chart switching.
The goal is to give traders a cleaner and faster way to understand where price may react, continue, or reverse based on wave and Fibonacci logic.
Key Features
1. Bullish and Bearish Wave Projection
The indicator separates bullish and bearish wave structures visually.
- Green lines and levels represent bullish wave projection areas.
- Red lines and levels represent bearish wave projection areas.
This allows traders to quickly distinguish between upside and downside target zones.
2. Fibonacci-Based Target Levels
WAVE FIBONACCI [tambangEA] automatically projects Fibonacci-based levels from detected wave structures.
These levels may act as:
- Potential reaction zones.
- Continuation targets.
- Support and resistance reference areas.
- Take-profit planning zones.
- Market structure confirmation areas.
3. Dashboard Panel
The built-in dashboard provides a clean and practical control center directly on the chart.
Dashboard information includes:
- Current symbol.
- Current timeframe.
- Active wave view mode.
- Usage guide.
- Multi-pair button navigation.
The panel is designed to stay above the chart, so it remains readable while price action and Fibonacci objects are displayed.
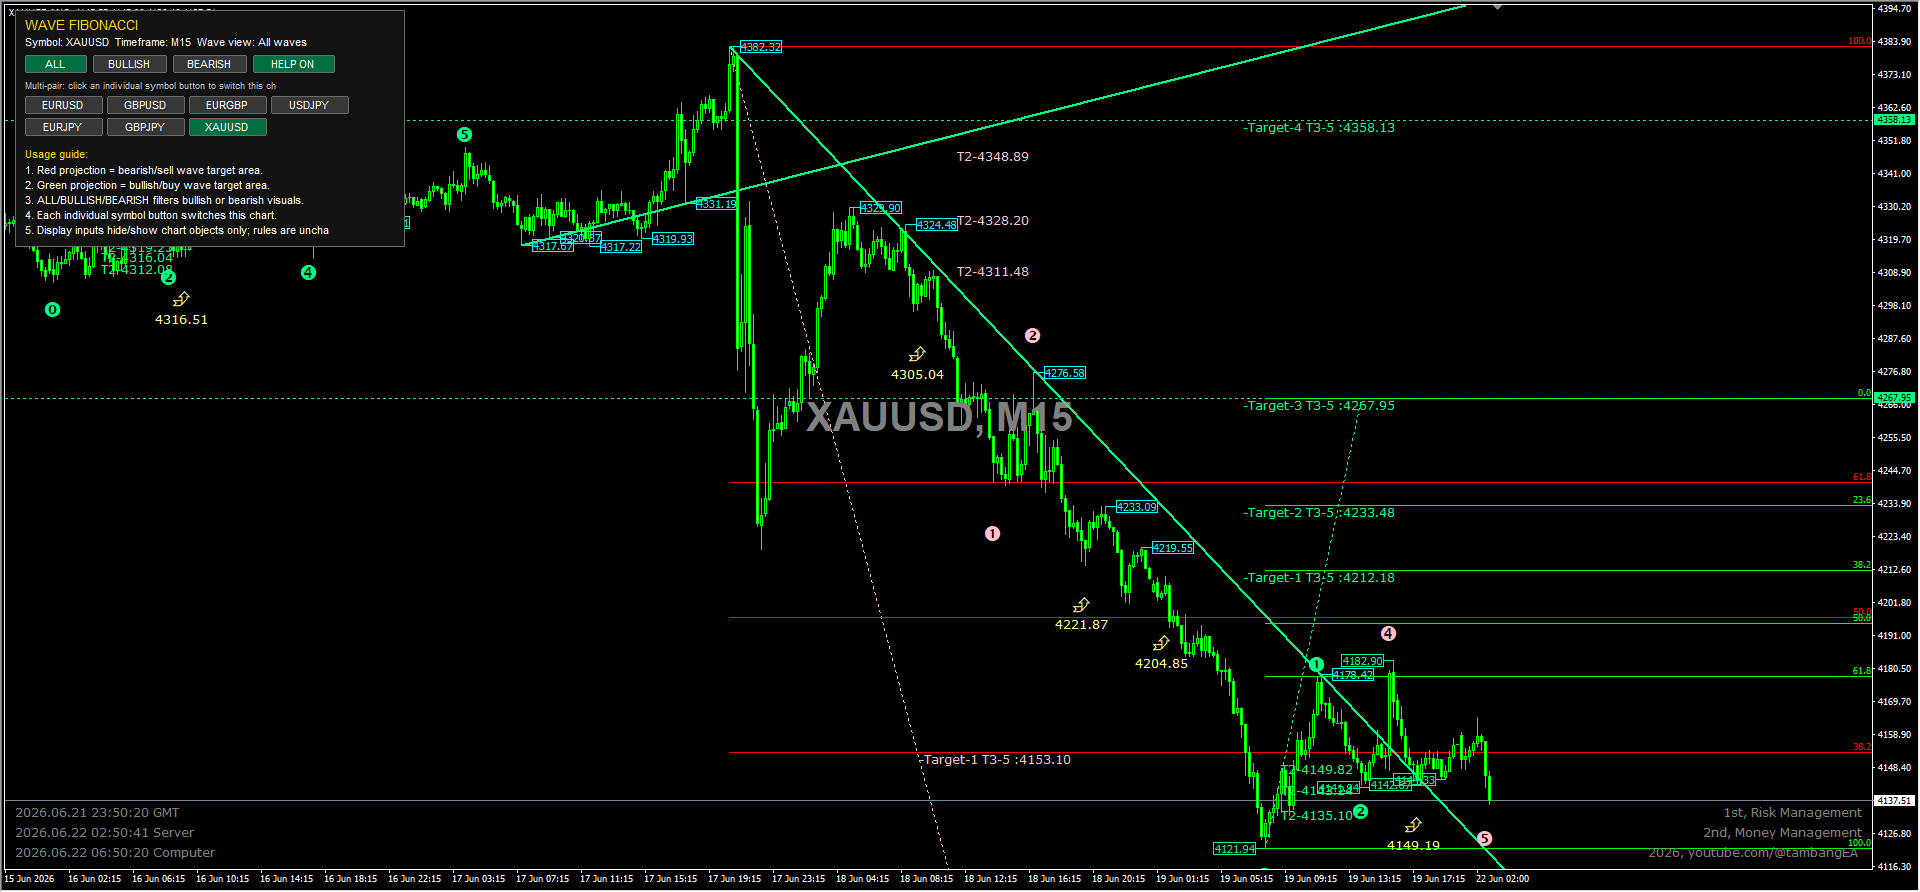
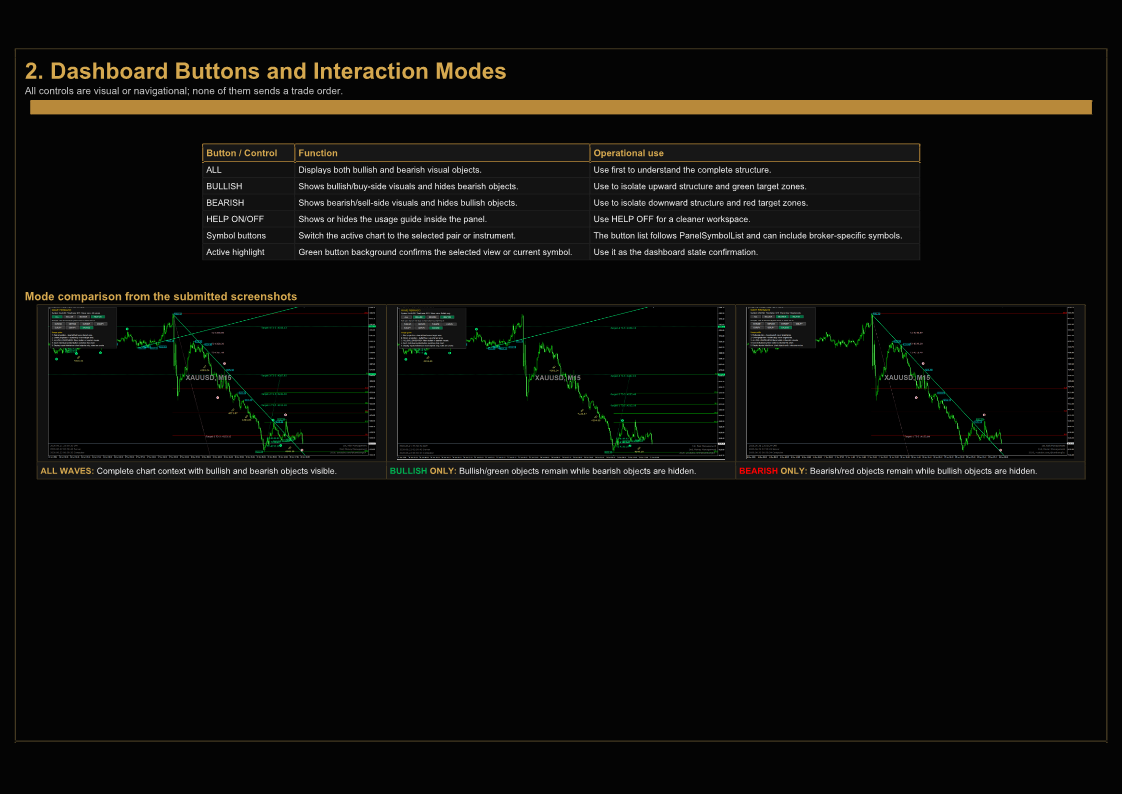
Dashboard Buttons
ALL
Displays both bullish and bearish visual objects.
Use this mode when you want to see the complete market structure, including both upside and downside projections.
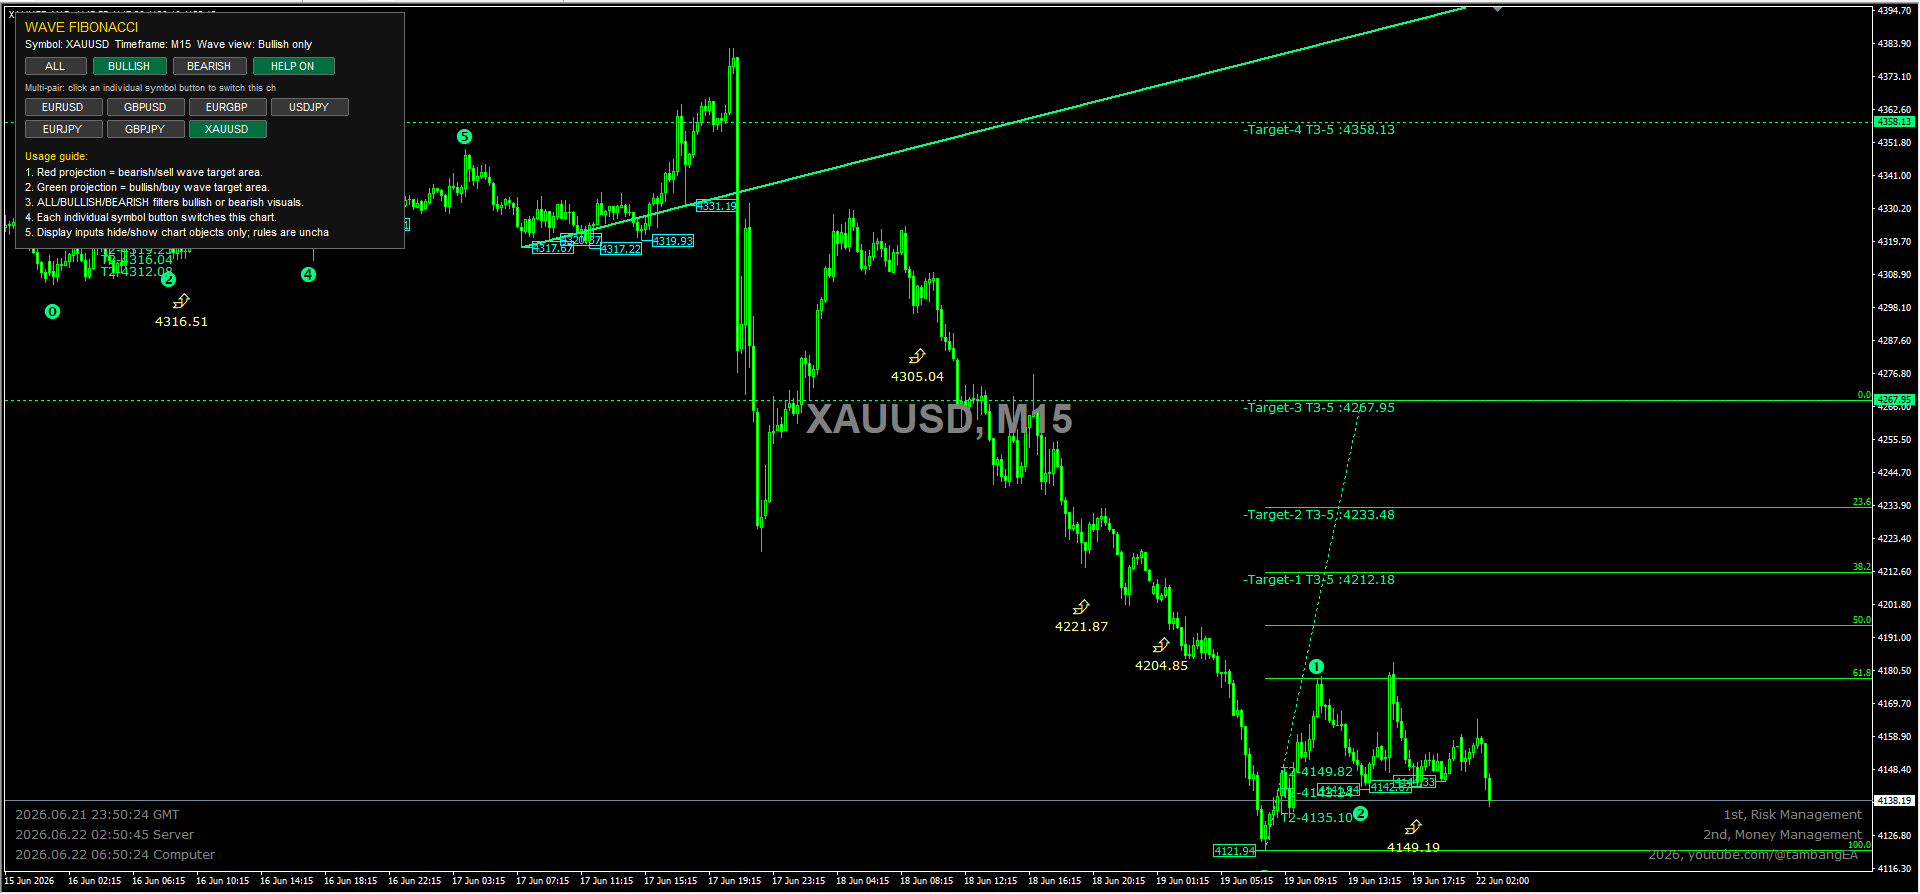
BULLISH
Displays only bullish-related visual objects.
This mode is useful when you want to focus on potential buy-side projections, bullish continuation zones, and upside Fibonacci targets.
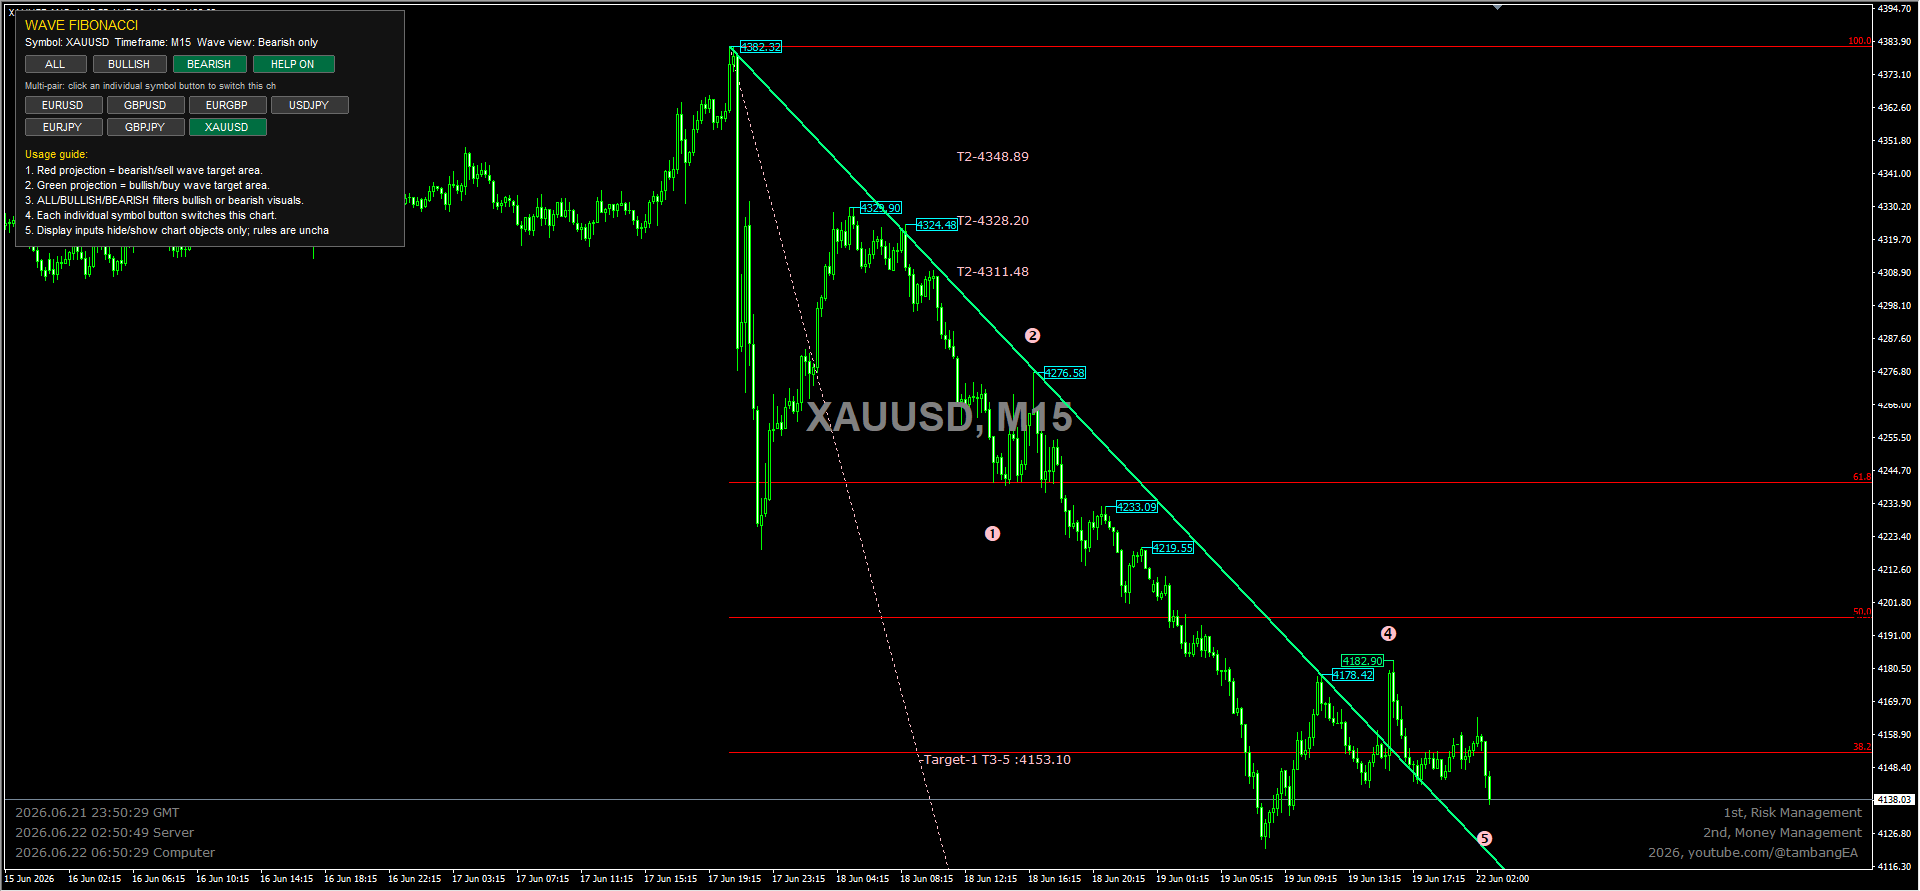
BEARISH
Displays only bearish-related visual objects.
This mode is useful when you want to focus on potential sell-side projections, bearish continuation zones, and downside Fibonacci targets.
HELP ON / HELP OFF
Shows or hides the usage guide inside the dashboard.
Use HELP ON when you want the on-chart explanation visible.
Use HELP OFF when you want a cleaner chart with less text.
Symbol Buttons
The dashboard includes individual symbol buttons such as:
- EURUSD
- GBPUSD
- EURGBP
- USDJPY
- EURJPY
- GBPJPY
- XAUUSD
Clicking a symbol button switches the current chart to that selected instrument.
The symbol list can be adjusted from the indicator input settings, depending on your broker symbols and trading preferences.
Display Options
The indicator includes input options to control which chart objects are displayed.
You can enable or disable:
- Wave swing points.
- Fibonacci projection objects.
- Wave target text.
- Horizontal target lines.
- DeMark-style signals.
- Sector trend lines.
- Sector pivot markers.
- Temporary sector markers.
- Micro trend channels.
These options allow traders to customize the chart according to their preferred level of detail.
Recommended Usage
WAVE FIBONACCI [tambangEA] is best used as a technical analysis assistant.
Recommended workflow:
- Select the desired symbol and timeframe.
- Use ALL mode to understand the full market structure.
- Switch to BULLISH mode to focus on potential buy-side targets.
- Switch to BEARISH mode to focus on potential sell-side targets.
- Combine the projected levels with your own confirmation tools, such as price action, trend direction, support and resistance, liquidity zones, or risk management rules.
- Use the Fibonacci target zones as reference areas, not as standalone entry signals.
Important Notes
This indicator does not guarantee future price movement.
Fibonacci levels and wave projections should be treated as analytical reference zones. They are not automatic buy or sell instructions.
For better decision-making, traders should combine this indicator with:
- Market structure analysis.
- Candlestick confirmation.
- Trend confirmation.
- Session behavior.
- Volatility conditions.
- Proper risk management.
Suitable For
WAVE FIBONACCI [tambangEA] can be used by:
- Forex traders.
- Gold traders.
- Multi-pair technical traders.
- Fibonacci traders.
- Wave structure traders.
- Price action traders.
- Traders who prefer visual chart analysis.
It can be applied to different timeframes, depending on trading style.
Examples:
- M5 and M15 for intraday analysis.
- M30 and H1 for short-term structure.
- H4 and D1 for higher-timeframe planning.
Risk Disclaimer
Trading Forex, commodities, indices, cryptocurrencies, and other financial instruments involves risk. Past performance and historical chart patterns do not guarantee future results.
WAVE FIBONACCI [tambangEA] is a technical analysis indicator. It does not provide financial advice, investment advice, or guaranteed trading signals.
Always use proper risk management and test the indicator on a demo account before using it in live trading.


")
![[XAUUSD]: Weekly Liquidity Activation Points (timings), June 22-26, 2026](https://c.mql5.com/6/1013/splash-preview-771790.png "[XAUUSD]: Weekly Liquidity Activation Points (timings), June 22-26, 2026")
")