
What is AntiOverfit PRO?
AntiOverfit PRO is a tool designed to evaluate the robustness of a trading system beyond a traditional backtest. Instead of analyzing an Expert Advisor only on the real historical market, it allows you to generate statistically coherent synthetic markets and observe how the strategy behaves in those alternative scenarios.
Its goal is to help answer a critical question: does the backtest result depend too much on the exact path the real market followed, or does the strategy remain stable when that path changes?
Contents
1. What is AntiOverfit PRO?
2. How does it work?
3. Step-by-step guide
4. Glossary and key terms
5. How to read the results
6. Final outcome
How does it work?
AntiOverfit PRO uses the real historical data of a symbol as its base and builds multiple synthetic worlds with similar statistical properties. These worlds can then be used in the Strategy Tester to run tests or optimizations across a set of plausible alternative market paths.
The tool automatically prepares the internal elements required for the workflow, such as source history, the world plan, and the original environment snapshot when needed, so the process feels more direct and natural for the user.
Once the optimization is complete, AntiOverfit PRO analyzes the results obtained on the synthetic worlds and calculates several metrics related to robustness, consistency, and sensitivity to changes in market path. This makes it possible to assess whether the original backtest reflects genuine robustness or a possible case of over-optimization.
Step-by-step guide
Step 1. Load AntiOverfit PRO onto the chart
Open a chart of the symbol you want to use as the basis for the analysis and attach AntiOverfit PRO to it.
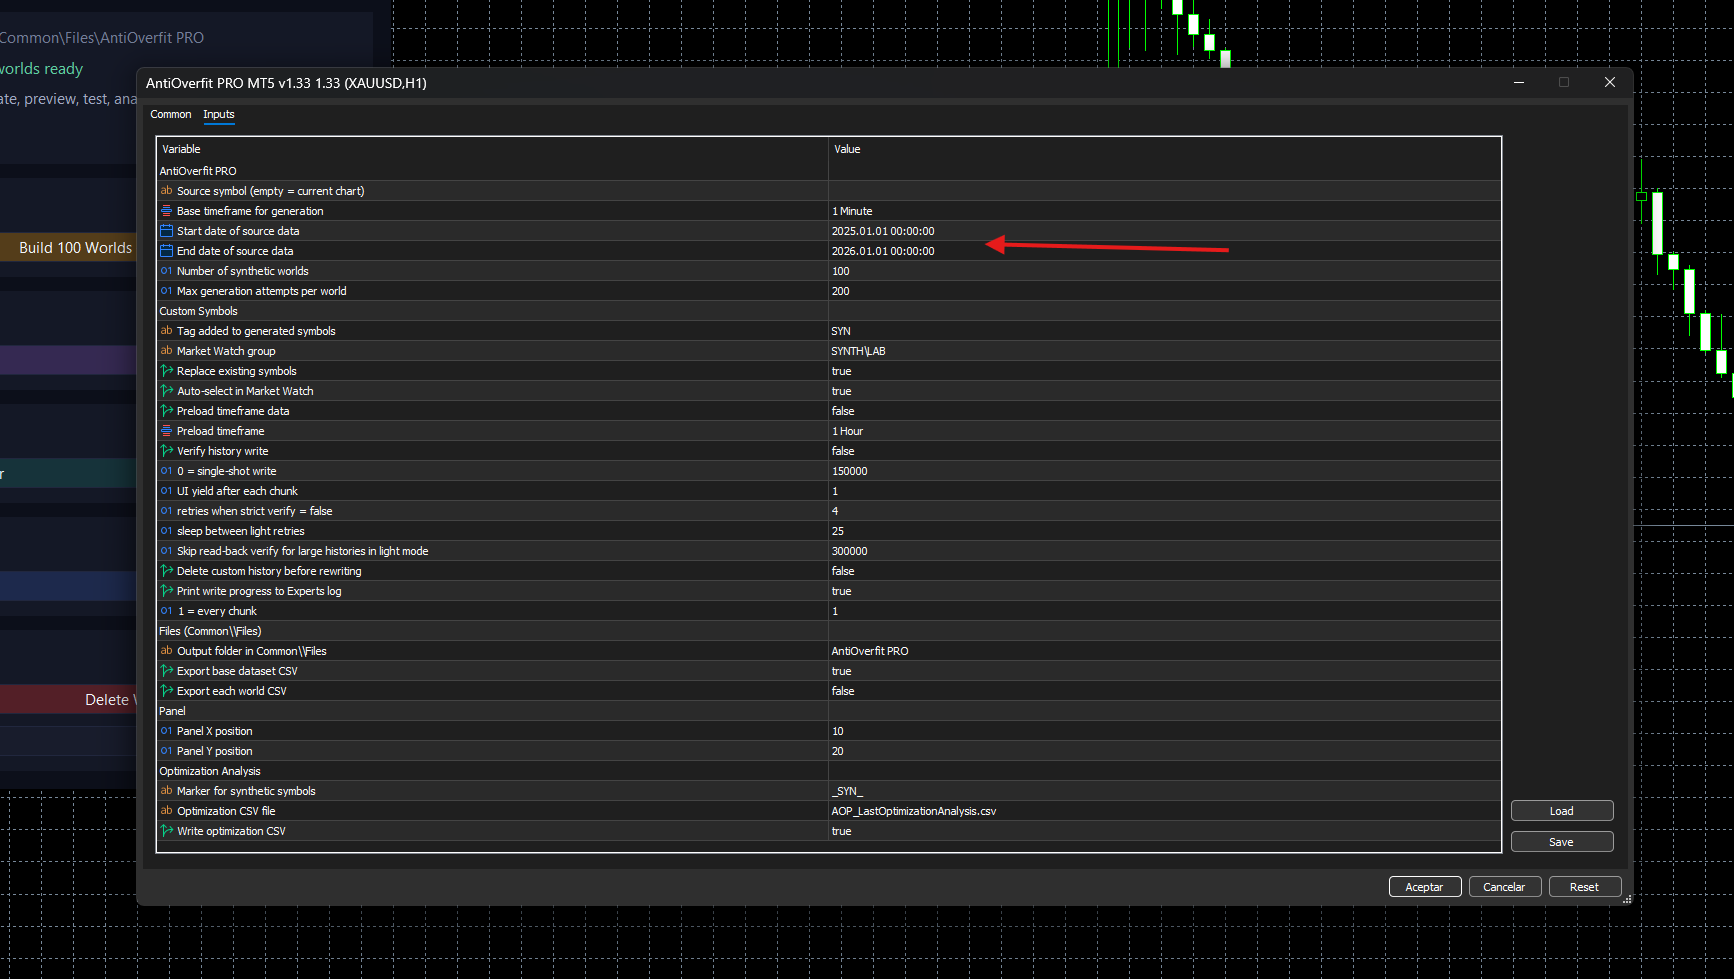
Step 2. Define the date range
Set the historical date range you want to use. That period will serve as the basis for building and testing the synthetic worlds.
It is also recommended to check the bar limit that MetaTrader 5 uses by default, as it may prevent AntiOverfit PRO from loading all the history needed for the analysis.
To check it, open Tools > Options > Charts and make sure that Max bars in chart and, preferably, also Max bars in history, are not set to a low value such as 100,000. Ideally, set them to a very high value or leave them unlimited, especially if you are going to work with long M1 histories. Important: After changing this setting, you must restart MetaTrader 5 for the change to take effect. This step is only necessary once.

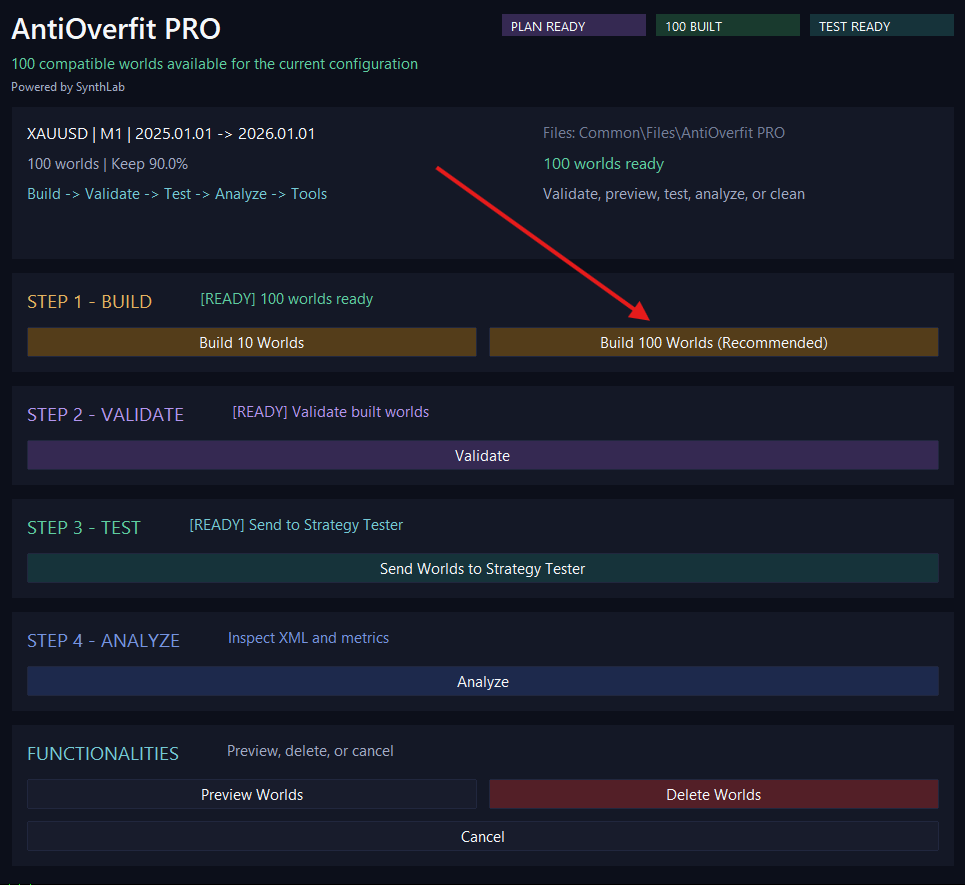
Step 3. Build the synthetic worlds
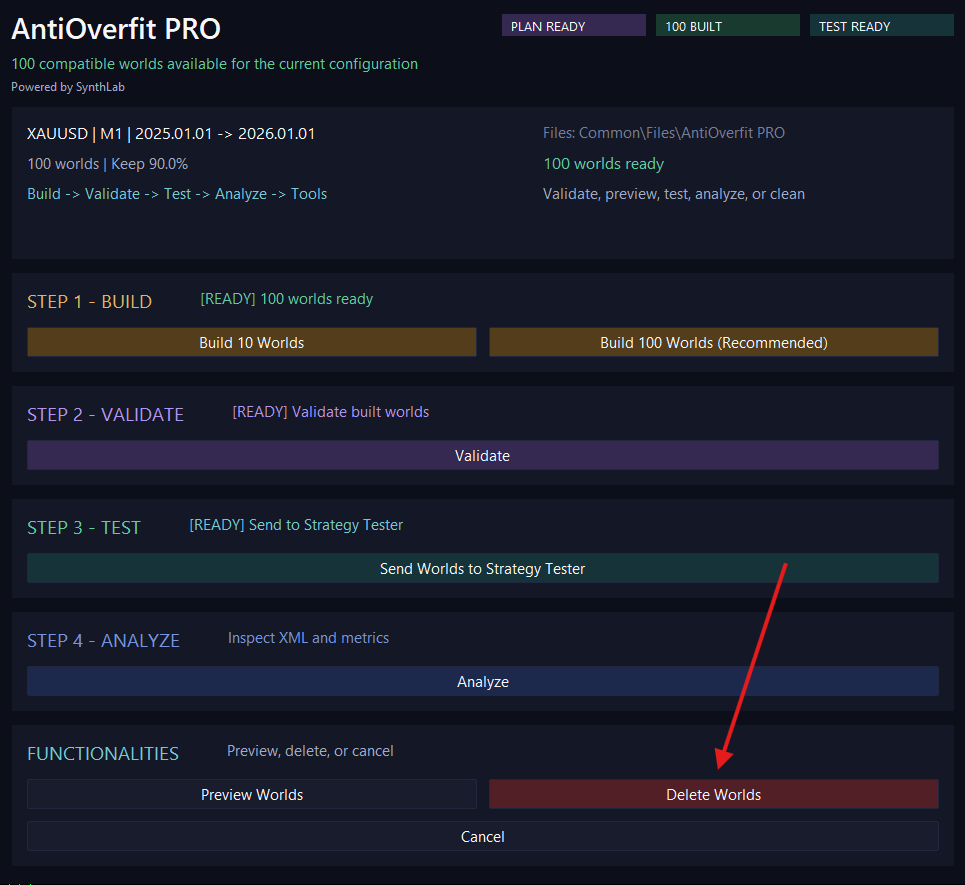
In the main panel, choose between Build 10 Worlds or Build 100 Worlds (Recommended), depending on how broad you want the test to be.
During this step, AntiOverfit PRO automatically prepares the source history and the internal world plan if they do not already exist or if they need to be updated. In previous versions, these actions appeared as separate steps, but they are now part of the automatic workflow.
If compatible worlds already exist for the current configuration, the tool can reuse them instead of rebuilding them unnecessarily.
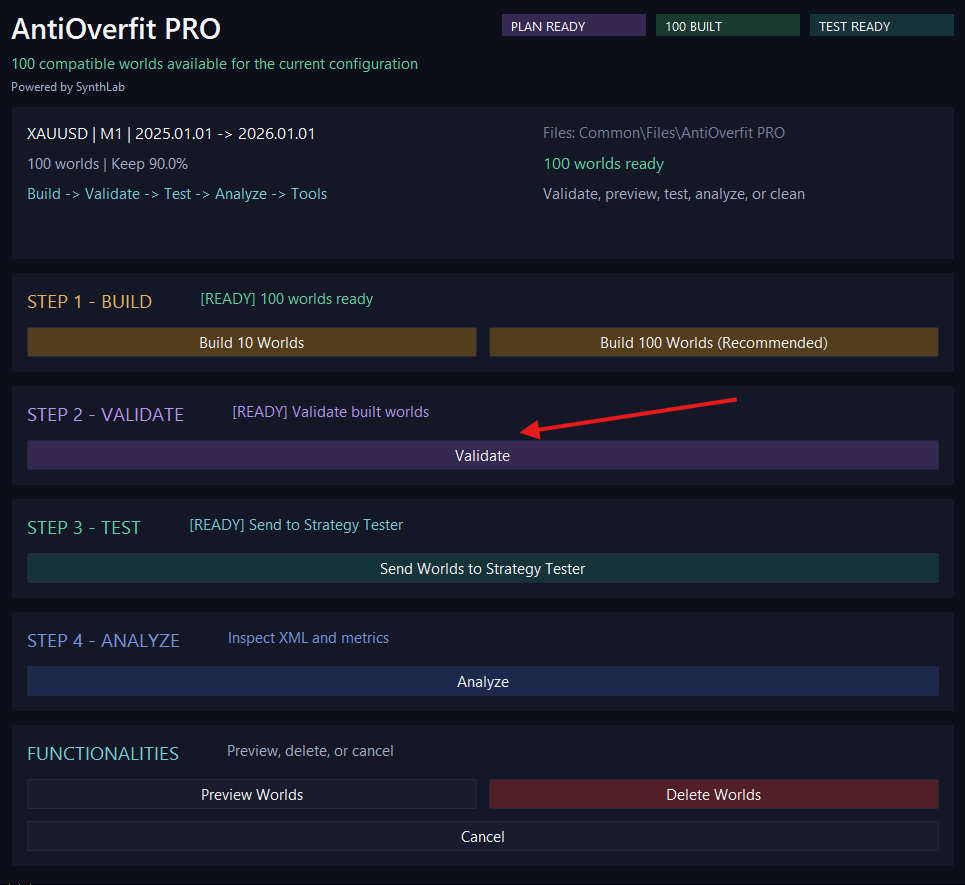
Step 4. Validate the built worlds
Click Validate to check that the built worlds preserve sufficient statistical coherence relative to the original market.
This step is important because it helps confirm the quality of the worlds that will later be used in the testing environment.
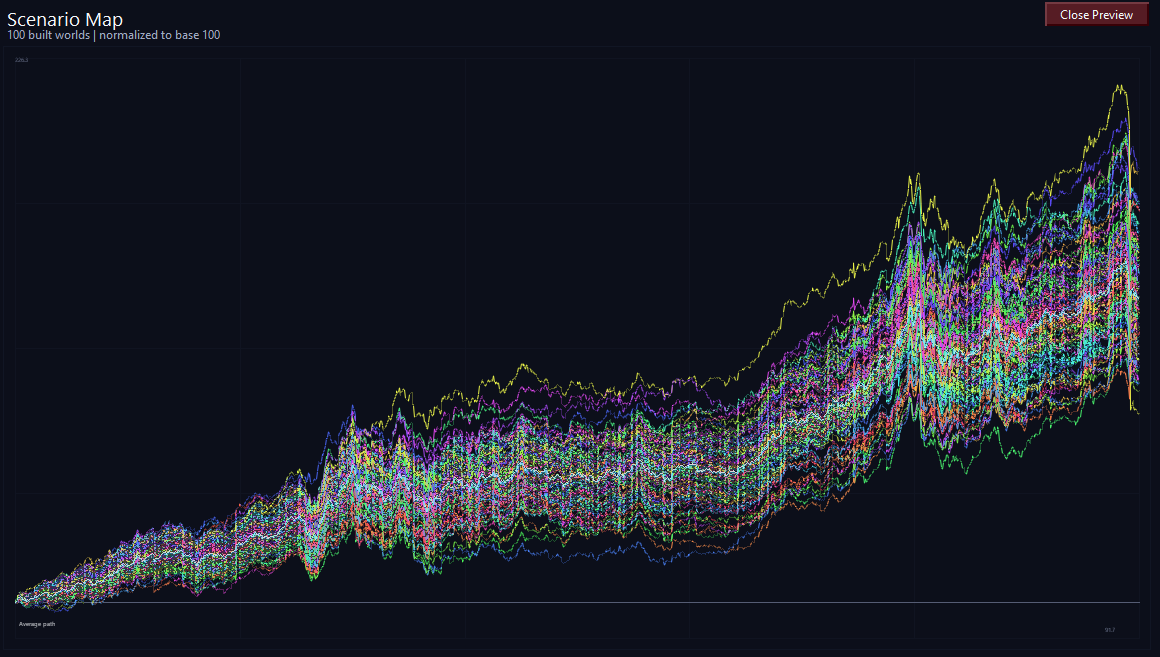
Step 5. Preview the built worlds
Click Preview Worlds to open a representative visual preview of the generated synthetic paths.
This step is optional, but it is useful for a quick visual check and to confirm that the set of built worlds looks reasonable before moving on to testing.
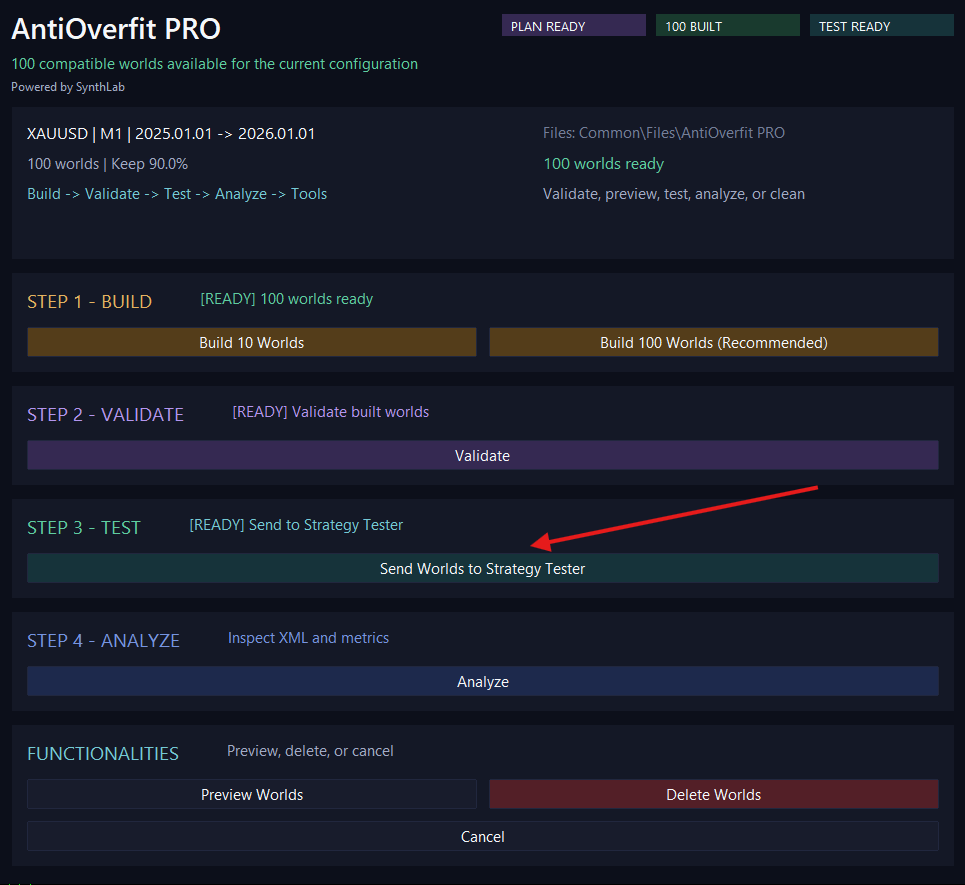
Step 6. Send the synthetic worlds to the Strategy Tester
Click Send Worlds to Strategy Tester to prepare the testing environment with the built synthetic symbols.
The tool automatically uses the saved snapshot so your original environment can be restored later if needed.
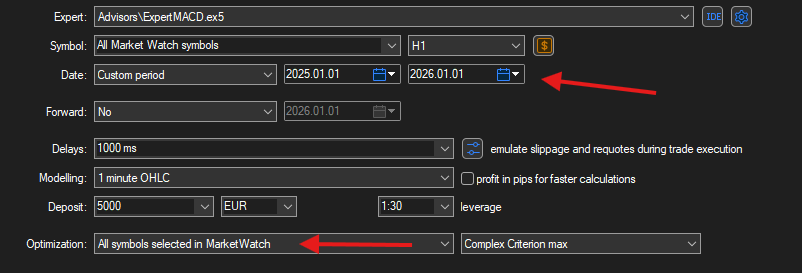
Step 7. Open and configure the Strategy Tester
Open the Strategy Tester from View > Strategy Tester or by pressing CTRL + R.
Then set exactly the same date range that you defined in AntiOverfit PRO so that the test respects the same analysis period.
If you are going to optimize an Expert Advisor, make sure the optimization runs on the synthetic symbols prepared by the tool.
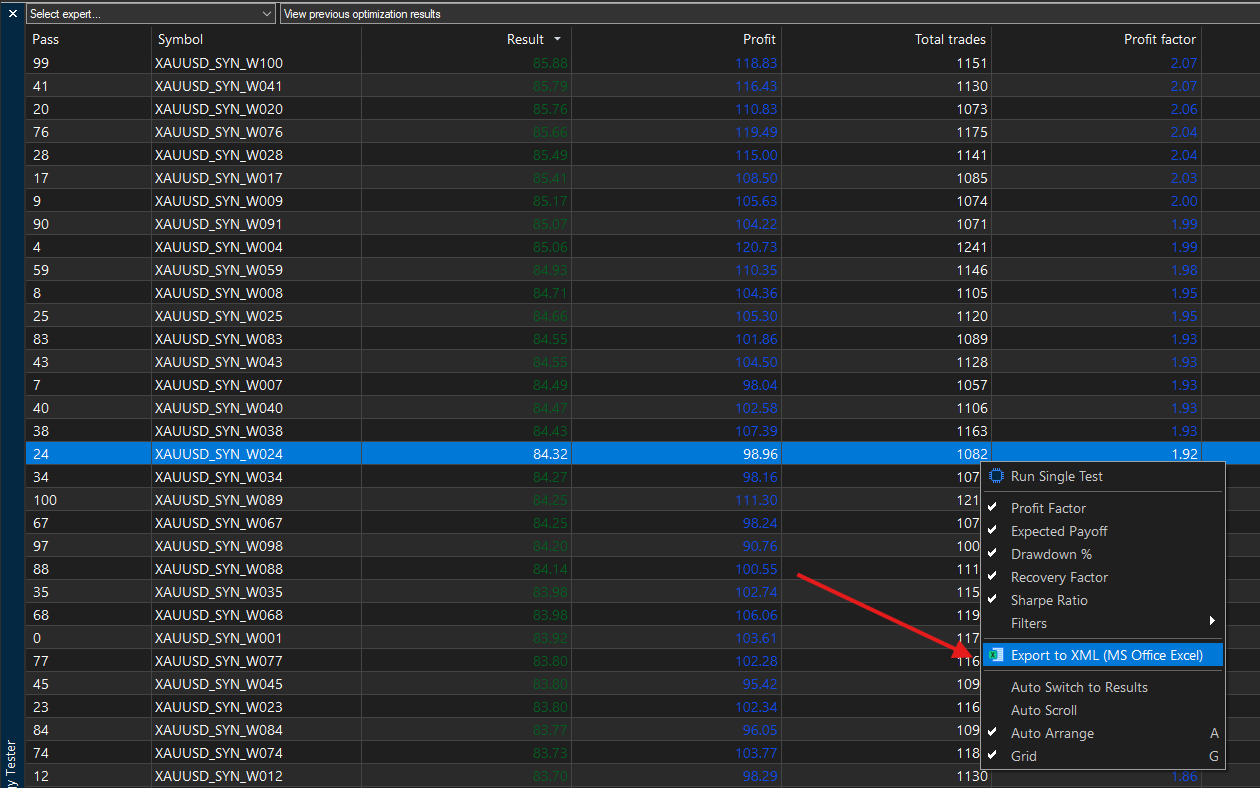
Step 8. Export the results
Once the optimization is complete, go to the Optimization Results tab and export the results to the Common/Files folder using the expected XML format and any filename you prefer.
Important: this step automatically exports the full optimization results list, not a single selected result.
To open the export menu, right-click inside the results area.
⚠️ It is recommended to close the file if your PC opens it automatically, as this may cause conflicts when AntiOverfit PRO tries to read it.
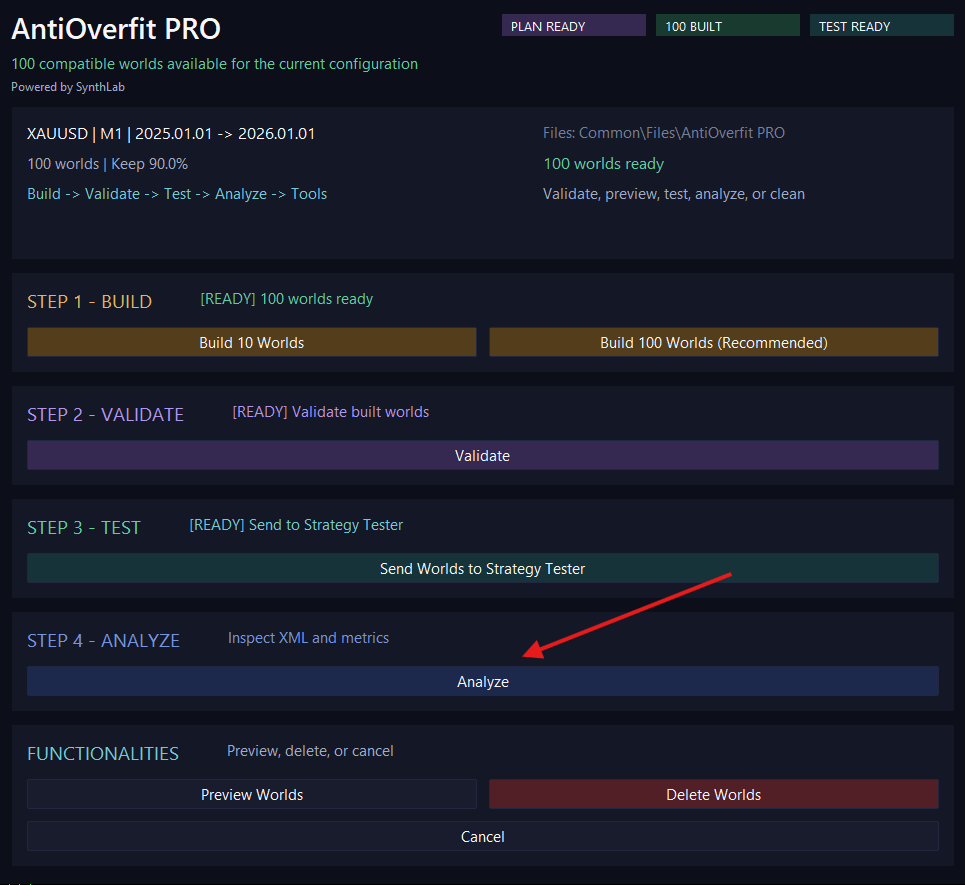
Step 9. Analyze the results
Return to the AntiOverfit PRO panel and click Analyze.
Select the exported XML file and the tool will open the analysis window, showing the Robustness Score and other relevant result metrics.
Step 10. Clean the environment when finished
When you are done, click Delete Worlds.
This action removes the generated synthetic worlds and, if a valid session snapshot exists, automatically restores your original environment.
Glossary and key terms
Main sections of the workflow
Build
The build stage. This is where AntiOverfit PRO generates the synthetic worlds that will later be used in the testing environment.
Validate
The validation stage. This is where the tool checks whether the built worlds preserve a sufficiently coherent statistical structure relative to the original market.
Test
The testing environment stage. This is where the tool prepares the synthetic symbols so they can be used in the Strategy Tester.
Analyze
The analysis stage. This is where the exported optimization XML report is imported and interpreted through the robustness dashboard.
Functionalities
The auxiliary block of the main workflow. It groups actions such as world preview, environment cleanup, and safe cancellation of ongoing tasks.
Buttons and actions
Build 10 Worlds
Builds exactly 10 synthetic worlds compatible with the current configuration.
Build 100 Worlds (Recommended)
Builds exactly 100 synthetic worlds compatible with the current configuration. This is the recommended option for stronger validation.
Validate
Checks the quality and statistical coherence of the built worlds.
Preview Worlds
Opens a visual preview of the generated synthetic paths.
Send Worlds to Strategy Tester
Prepares the environment so the synthetic worlds can be used in the Strategy Tester.
Analyze
Loads the exported optimization XML report and opens the robustness analysis window.
Delete Worlds
Removes the generated synthetic symbols from the terminal and restores the original environment if a valid session snapshot exists.
Cancel
Requests a safe stop of the current process at the next valid checkpoint.
Save
Exports a PNG image of the current analysis view.
Close
Closes the current analysis window.
Natural Interpretation
Opens a plain-language explanation of the current result inside the analysis window. It is intended to summarize the meaning of the score without replacing the quantitative metrics.
Panel status words
PLAN READY
The internal generation plan already exists and can be used when needed.
BUILT
Shows how many compatible worlds are available for the current configuration.
TEST READY
The environment is ready to send the synthetic worlds to the Strategy Tester.
READY
The step or action is ready to be executed.
RUNNING
The tool is currently processing a task.
OPEN
A secondary preview or analysis window is open.
ERROR
The action failed and requires attention.
OK
The action completed successfully.
Main concepts
Original Market
The real historical market data of the symbol. It is the actual path the market followed in the past.
Synthetic World / Synthetic Worlds
Alternative market paths generated from the original data while preserving key statistical characteristics. They are used to check whether a strategy depends too much on the exact historical path that happened in reality.
World
An individual synthetic market path.
Compatible Worlds
Synthetic worlds that remain valid for the current symbol configuration, date range, and generation parameters.
World Plan
The internal recipe used to generate the synthetic worlds. In the current version it is prepared automatically when needed and is no longer part of the manual user workflow.
Source History
The original historical data loaded from the real symbol and timeframe. It is also handled automatically when needed.
Base M1
The original M1 data used as the base layer for synthetic generation.
Keep Percentage
The percentage of the original structure that is preserved during synthetic generation. Higher values usually keep the generated world closer to the structure of the original market, while lower values introduce more variation.
Snapshot
An automatic copy of the original environment before synthetic symbols are activated. It is used to restore it later.
Synthetic Symbols
The MT5 custom symbols created from the synthetic worlds.
Scenario Map
A visual chart that shows the generated paths of the built synthetic worlds.
Normalized to base 100
All preview curves start from the same reference level so that you can compare their shape and evolution more easily.
Validation and generation terms
Validation
The process of checking whether the built synthetic worlds preserve enough statistical proximity to the original market to be accepted for testing.
Attempt
One attempt to generate a synthetic world. If a world does not pass the validation filters, it is rejected and another attempt is made.
Accepted World
A synthetic world that passed the validation criteria.
Rejected World
A generated world that did not meet the validation requirements and was therefore discarded. This usually means the quality filter is working correctly.
Analysis window: sections and navigation
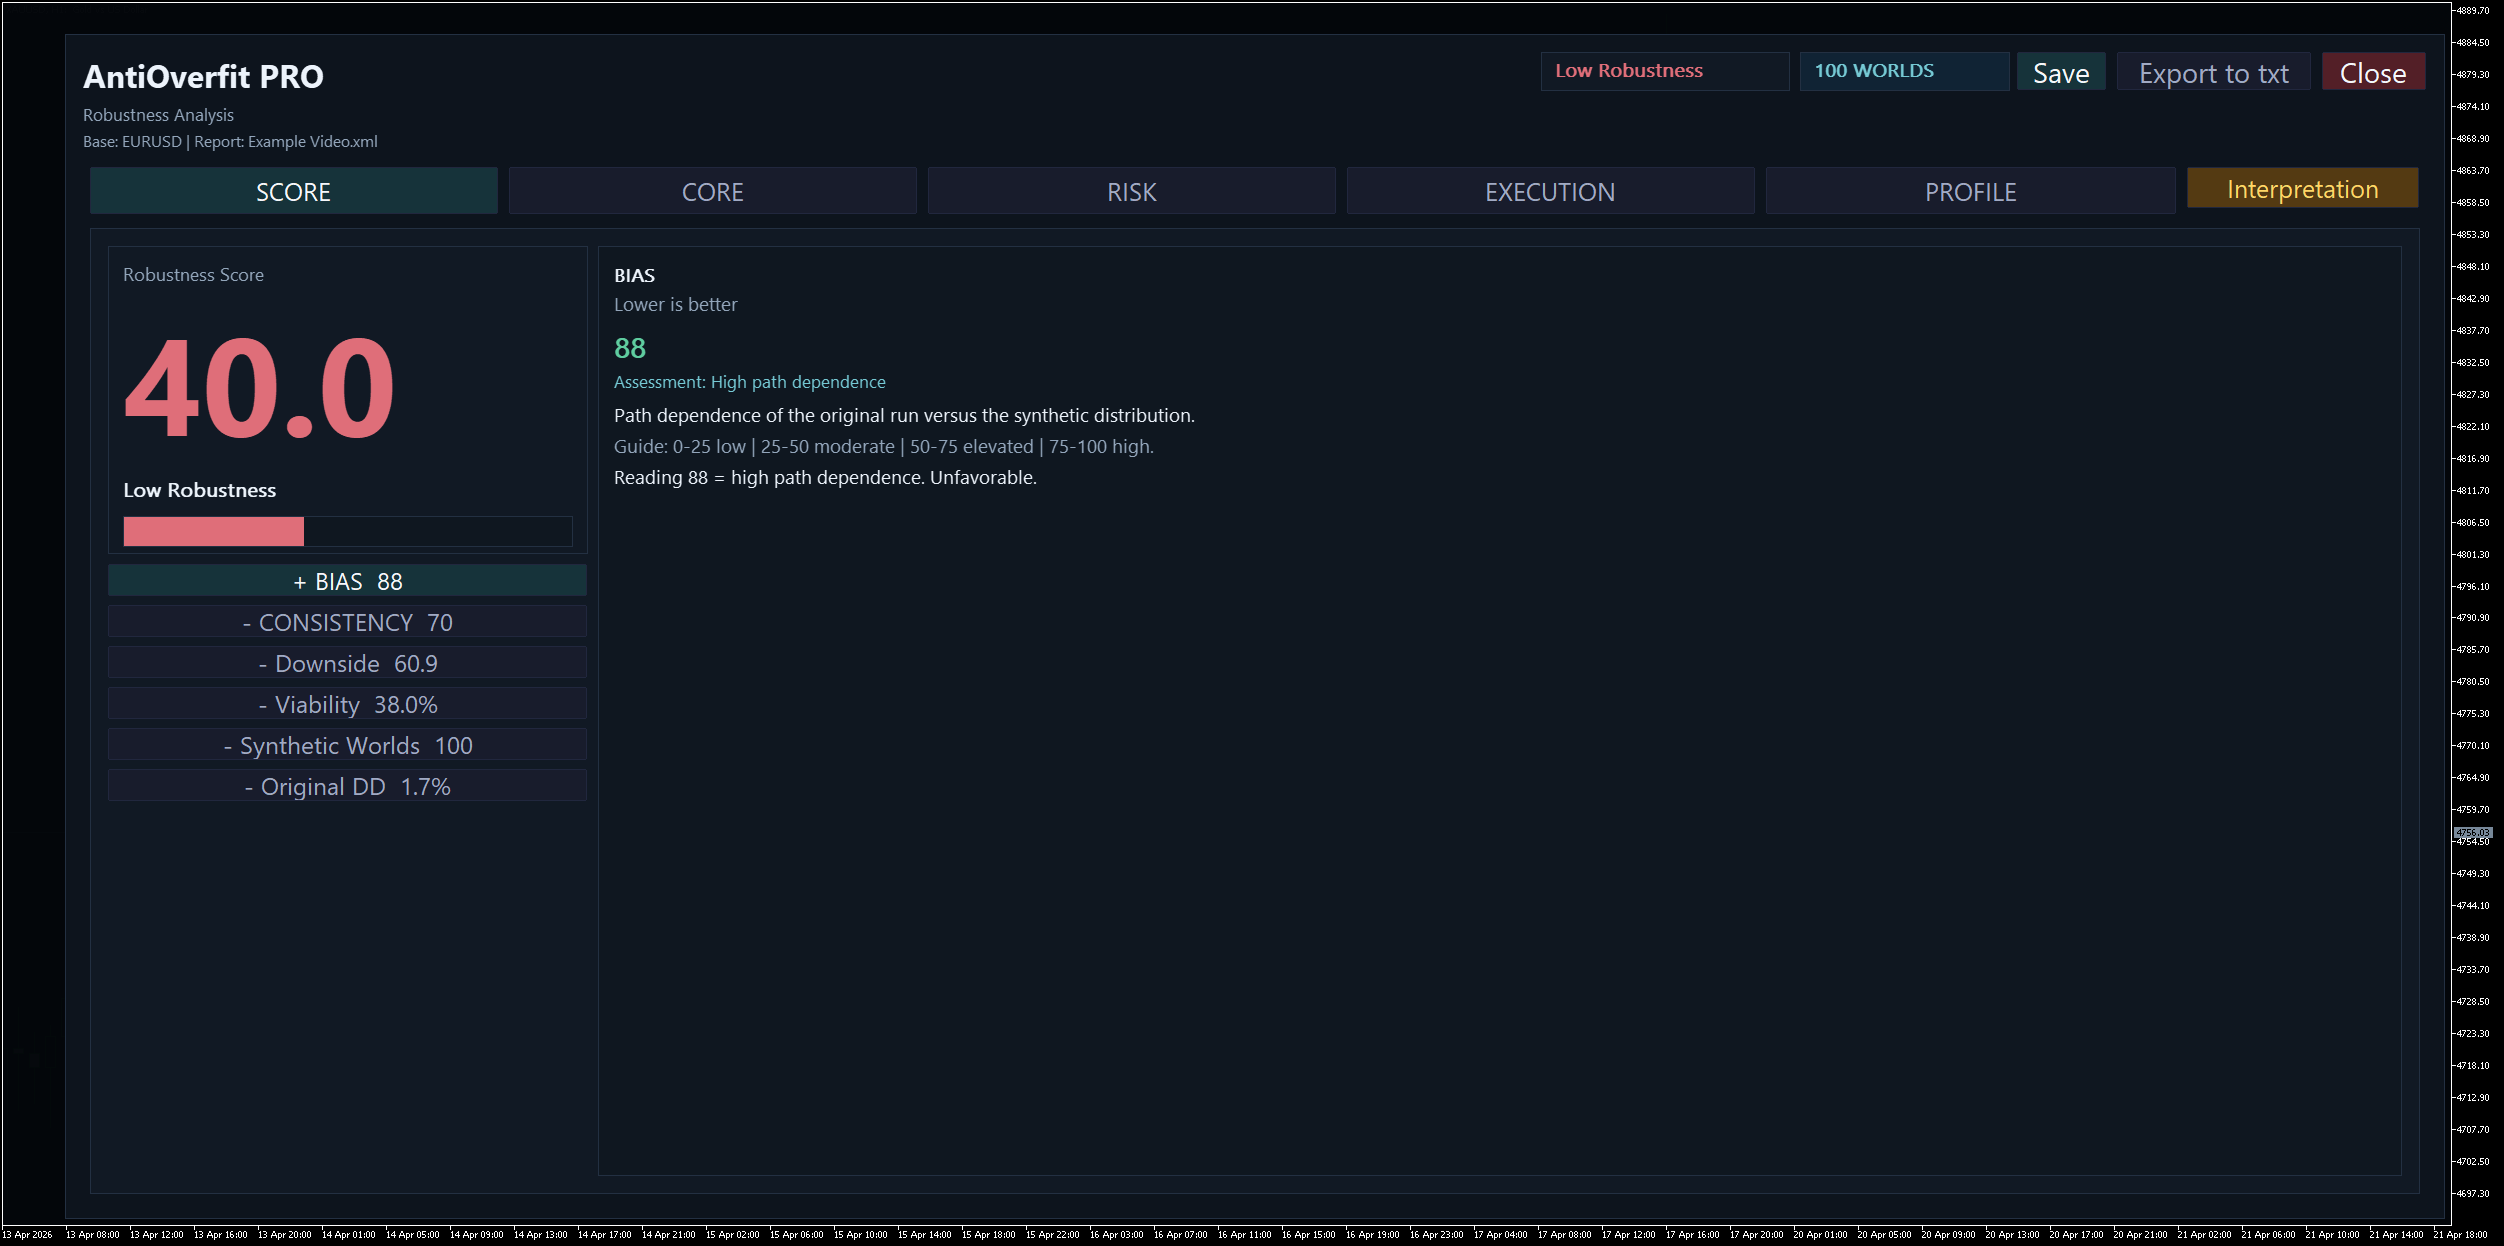
Score
The main summary tab. It shows the overall Robustness Score, the main interpretation, and the most important supporting dimensions.
Core
Focuses on central robustness-related metrics such as Profit Factor, Expected Payoff, and the behavior of their distributions across worlds.
Risk
Focuses on drawdown and downside behavior, including how bad scenarios deteriorate under synthetic variation.
Execution
Focuses on operational behavior, such as number of trades and other execution-sensitive stability measures.
Profile
Provides a profile-style summary of the analyzed setup, combining multiple behavioral dimensions into a compact diagnostic view.
Expanded metric panel
The lower panel of the Score tab. It opens one metric at a time so the explanation can be read clearly without overcrowding the screen.
Accordion buttons
The metric selectors in the Score tab. When one is opened, the others are closed.
Status chips
The labels shown near Save and Close, such as the robustness label and the number of worlds used in the analysis.
Optimization analysis terms
Robustness Score
The overall score that summarizes how stable and representative the original optimization result is when compared with the synthetic distribution. It is not a classic profit score.
Robustness Label
The plain-language label associated with the main score, such as Poor Robustness, Fragile, Moderate Robustness, or High Robustness. It gives a quick and readable summary of the range in which the score falls.
Bias
Measures how much better the original result appears compared with the synthetic distribution. In practice, it asks whether the original backtest looks unusually favored by the exact path of the real market. Lower Bias is better.
Consistency
Measures how stably the strategy behaves across different synthetic worlds. High Consistency means the system behaves similarly under many realistic market variations.
Downside
Measures how much the worst synthetic cases deteriorate. It focuses on the negative tail of the distribution and on how severe bad scenarios can become.
Viability
Measures how many synthetic worlds remain acceptable when the market path changes. A higher value means the setup survives more often under alternative paths.
Synthetic Worlds
The number of usable synthetic worlds included in the analysis. More worlds usually imply stronger evidence and a more reliable diagnostic context.
Original DD
The drawdown of the original backtest result used as a reference. It helps compare the original risk level with the synthetic distribution.
Flat Distribution Warning
A warning that appears when the analyzed distribution is too flat or not informative enough to support a strong interpretation. It means the score should be read with greater caution.
Assessment
A brief plain-language evaluation associated with a metric, such as Acceptable stability or Moderate path dependence.
Guide
The reference scale shown inside the expanded metric panel. It explains how to interpret low, moderate, high, or strong values for that specific metric.
Reading
The final plain-language sentence that directly interprets the current value of the metric.
Original / Orig
The result obtained on the original historical market path.
Median
The central value of the synthetic distribution.
Min / Max
The lowest and highest values observed among the accepted synthetic worlds.
P10-P90
The range between the 10th and 90th percentiles of the synthetic distribution. It gives a quick view of dispersion and stability.
Profit Factor
Gross profit divided by gross loss.
Expected Payoff
Average result per trade.
Recovery Factor
A performance measure that relates profit to drawdown.
Equity DD %
Equity drawdown percentage.
Trades
The number of trades. It is mainly an operational stability metric, not a direct profitability measure.
Low Evidence
The original result does not provide enough evidence on its own, or the available synthetic information is too weak to support a confident conclusion.
Low Worlds
There were too few synthetic worlds available or accepted to support a strong conclusion.
How to read the results
The score is not profit.
A high score does not automatically mean the EA makes a lot of money. It means the original result appears more stable and representative when the market path changes.
Consistency is not profitability.
Consistency measures stability across worlds, not how much money the strategy makes.
A good original backtest is not enough.
The key question is whether similar behavior is maintained when the strategy is tested across many synthetic worlds.
A low score usually suggests path dependence.
This means the strategy may depend too much on the exact historical path that happened in reality.
Bias should be read together with Consistency.
A setup may look good in the original execution and still be weak under alternative paths. Bias helps detect whether the original looks unusually favored; Consistency helps confirm whether that behavior repeats.
Downside matters even when the score is acceptable.
A setup may still show significant risk in the worst synthetic cases, so poor downside should not be ignored.
Viability indicates survival, not excellence.
A high viability reading means the setup stays above the acceptability threshold more often, but it does not guarantee superior performance.
Natural Interpretation is a summary, not a substitute.
Use it as a quick explanatory layer, but rely on the metric details when you need deeper judgment.
Rejected worlds are not necessarily a problem.
If a world is rejected during generation or validation, it usually means the quality filter is doing its job.
Preview Worlds is visual, not the final verdict.
The Scenario Map helps you inspect behavior, but the real interpretation comes from consistency, robustness, and the optimization analysis.
Delete Worlds is not just cleanup.
In addition to removing the synthetic symbols, this action helps return the environment to its original state when a valid session snapshot exists.
Final outcome
Once the process is complete, AntiOverfit PRO will have evaluated how your strategy behaves across multiple plausible synthetic markets, allowing you to determine whether the original backtest reflects consistent robustness or excessive dependence on the real historical path.


")
