
Trendlines With Breaks Indicator for MetaTrader 5
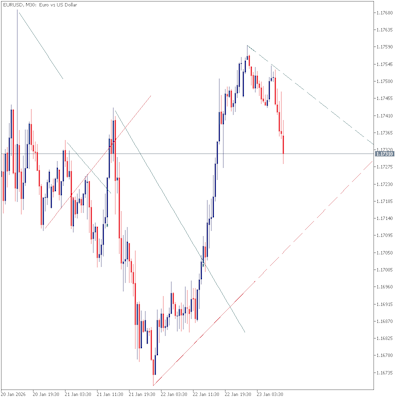
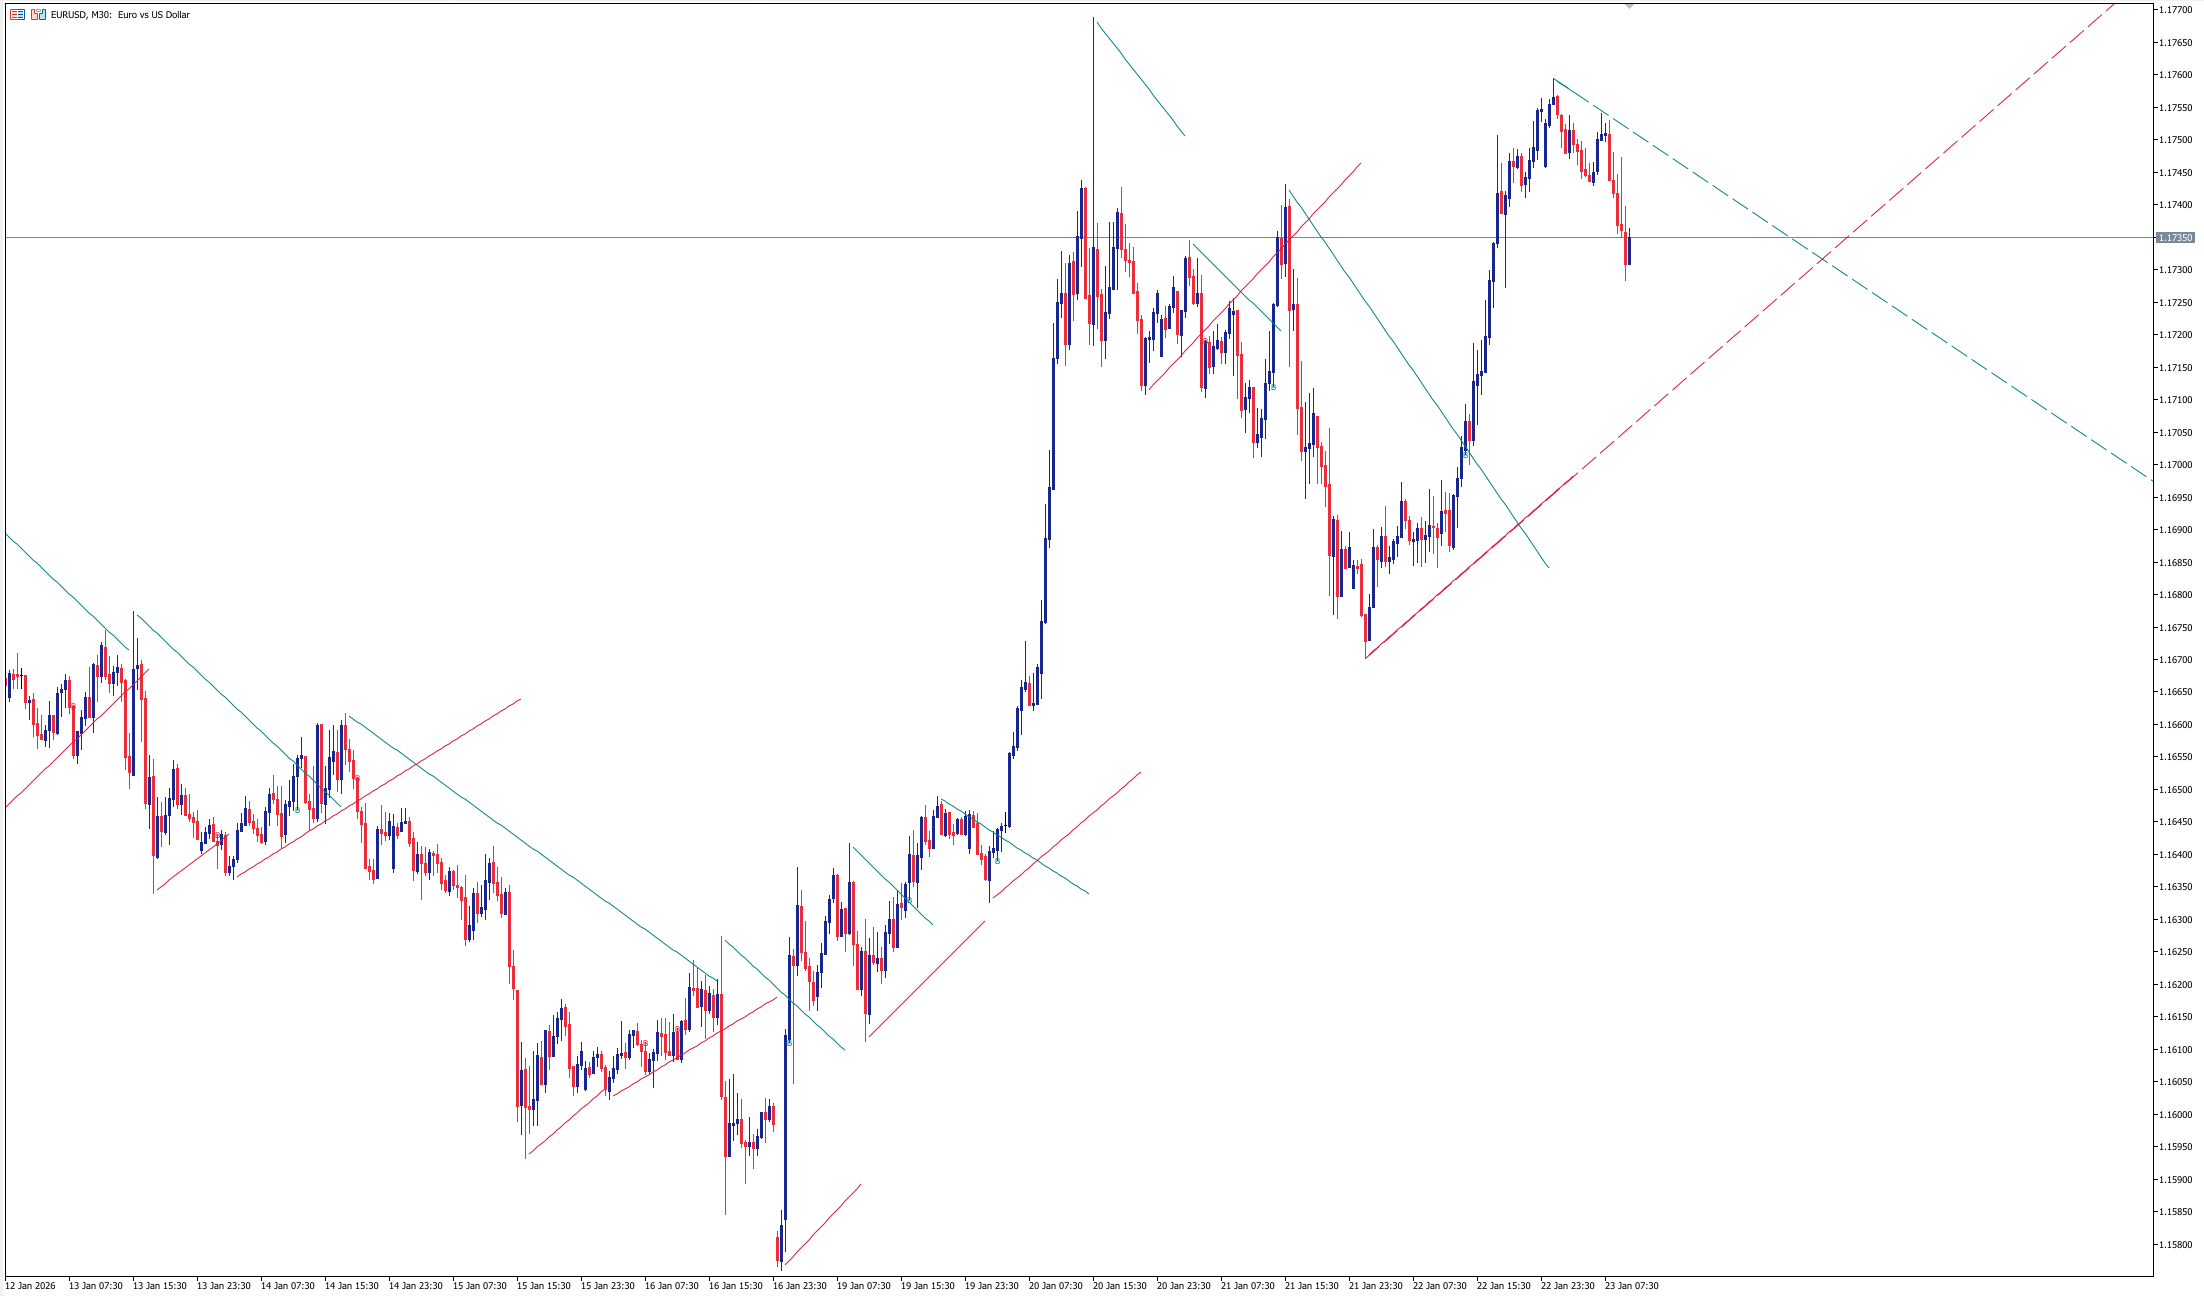
The Trendlines With Breaks indicator is designed to automatically draw trendlines based on recent swing points and highlight breakout moments when price breaks a trendline. It helps traders monitor dynamic support and resistance structure without manual drawing.
Indicator Logic
Trendlines Breaks detects swing highs and swing lows, builds trendlines from these points, and updates the lines as new price data appears. When price crosses a trendline, the indicator marks the break on the chart to help identify potential continuation or reversal scenarios.


Key Features
-
Automatic trendline drawing based on swing points
-
Visual marking of trendline breaks on the chart
-
Dynamic update of lines as market structure changes
-
Suitable for multiple symbols and timeframes
-
Works as a structure and confirmation tool, not a trade signal generator
Recommended Use
-
Use trendlines to define current market bias and structure
-
Monitor break events and wait for confirmation from price action or market structure
-
Combine with higher timeframe context and risk management rules before entering trades
Notes
Trendlines Breaks is intended for market structure analysis. Traders typically use it to reduce manual chart work and to track trendline breaks consistently across instruments.


")