

Introduction
A simple guide to using Abiroid Range Filtered Trend Signals
MT4 version:
https://www.mql5.com/en/market/product/149941/
MT5 version:
https://www.mql5.com/en/market/product/150789/
This indicator helps you see trends, ranges, and breakouts.
Features
- Kalman smoothing to reduce market noise.
- Supertrend bands for trend direction.
- Color-coded dots and arrows for quick reading.
- Arrow signals for trend continuation.
- Alerts for trend changes.
- Adjustable inputs for different styles.
How to Use
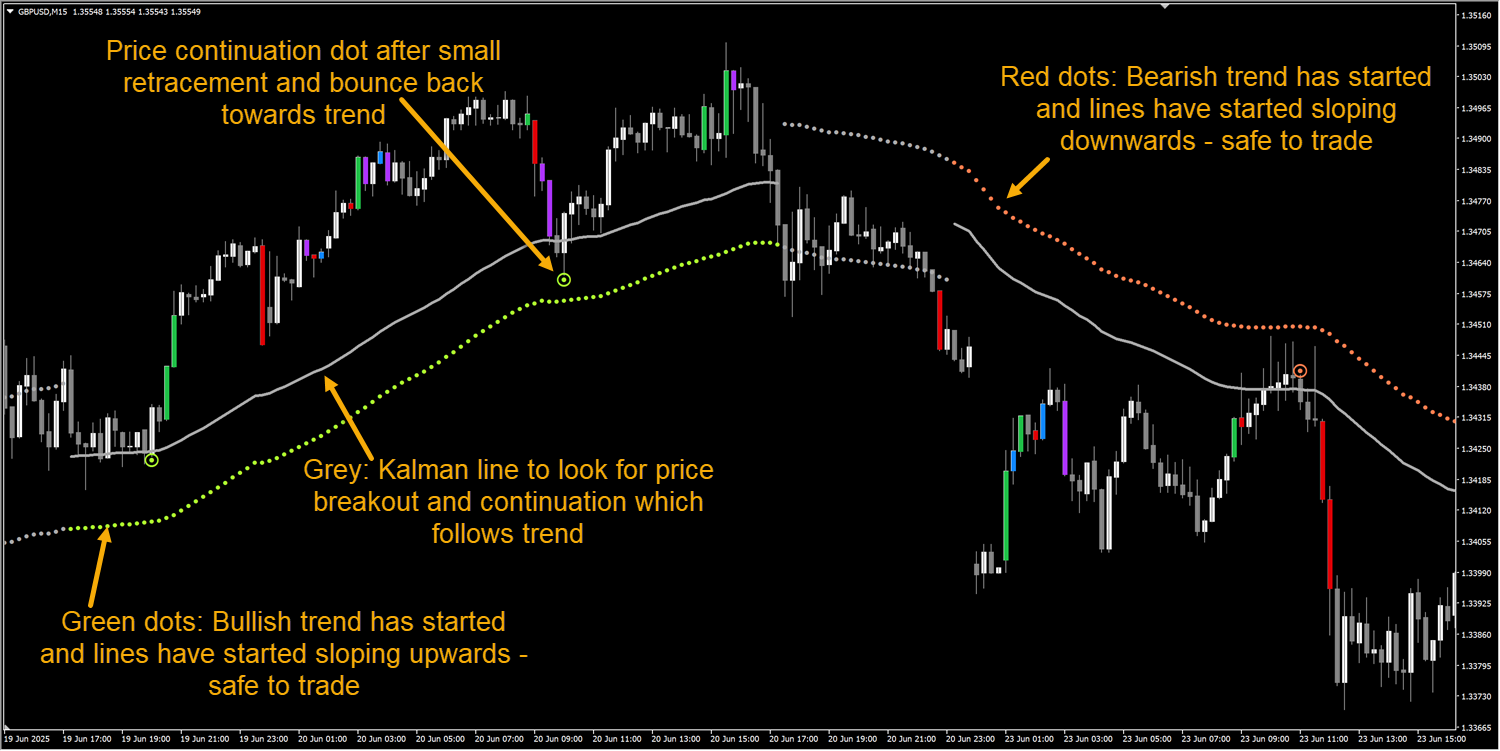
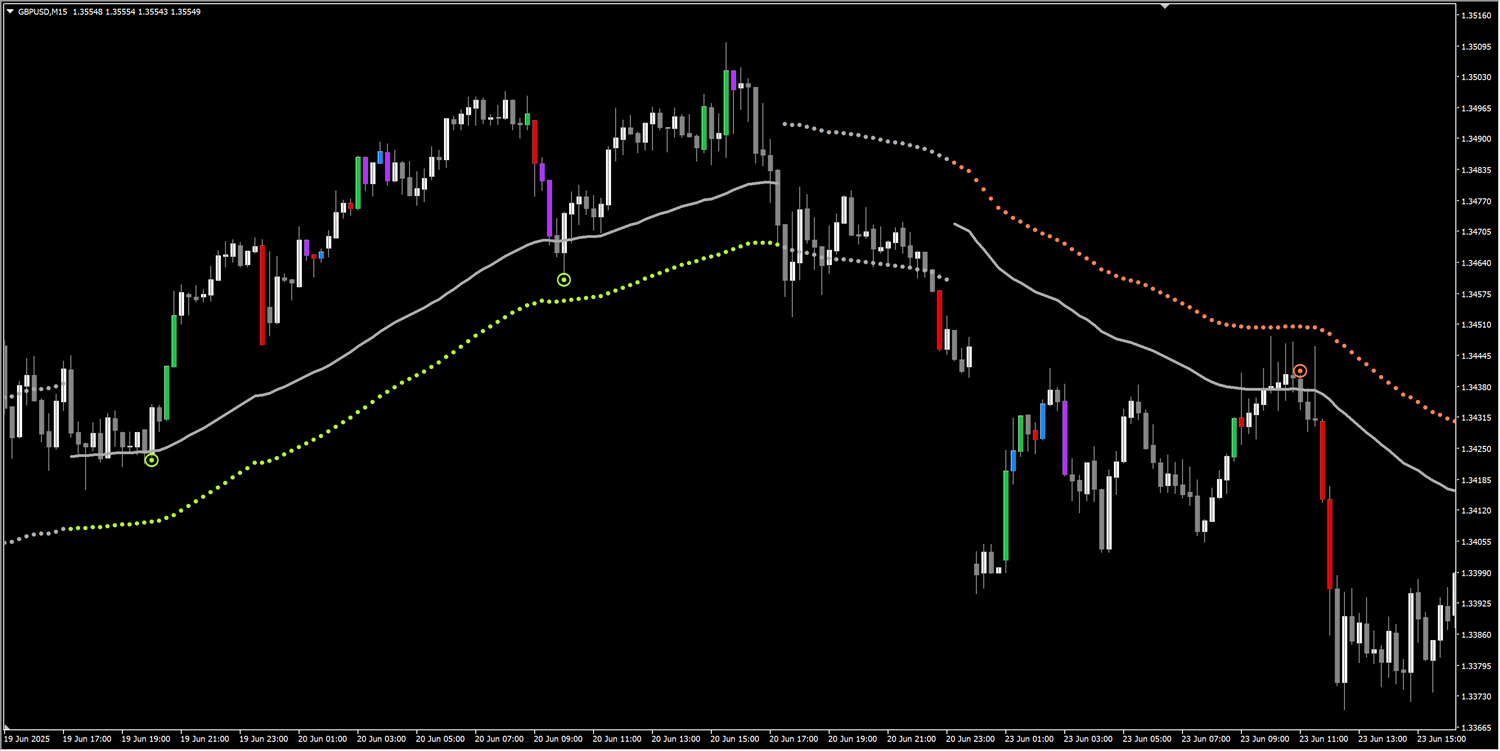
- Green dots = bullish bias. Red dots = bearish bias. Gray dots = ranging (do not trade).
- For Bullish, make sure that the dots are in a slight upwards slope to confirm up trend and for Bearish dots should be slightly sloping downwards
Note that after trend slope has started, when a retracement happens back to center gray Kalman line, it will flatten a little. That's expected. But overall channel should have already started a slope after trend change.
Do not trade signals, when the lines are flat like this:
This indicates a ranging market. This indicator works best during a trending market.
- Best timeframes:
- Scalping: M1–M15 (faster Kalman, shorter ATR).
- Day trading: M15–H1 (default settings work well).
- Swing: H4–D1 (smoother Kalman - higher kalman alpha like 0.05, higher ATR factor).
- Market type:
- Trending pairs depending on market timings: EUR/USD, GBP/USD, AUD/USD.
- Avoid very thin/low-liquidity pairs during off-hours.
- Quick tip: Check higher timeframe trend first (e.g., H4) then use M15 for entries.
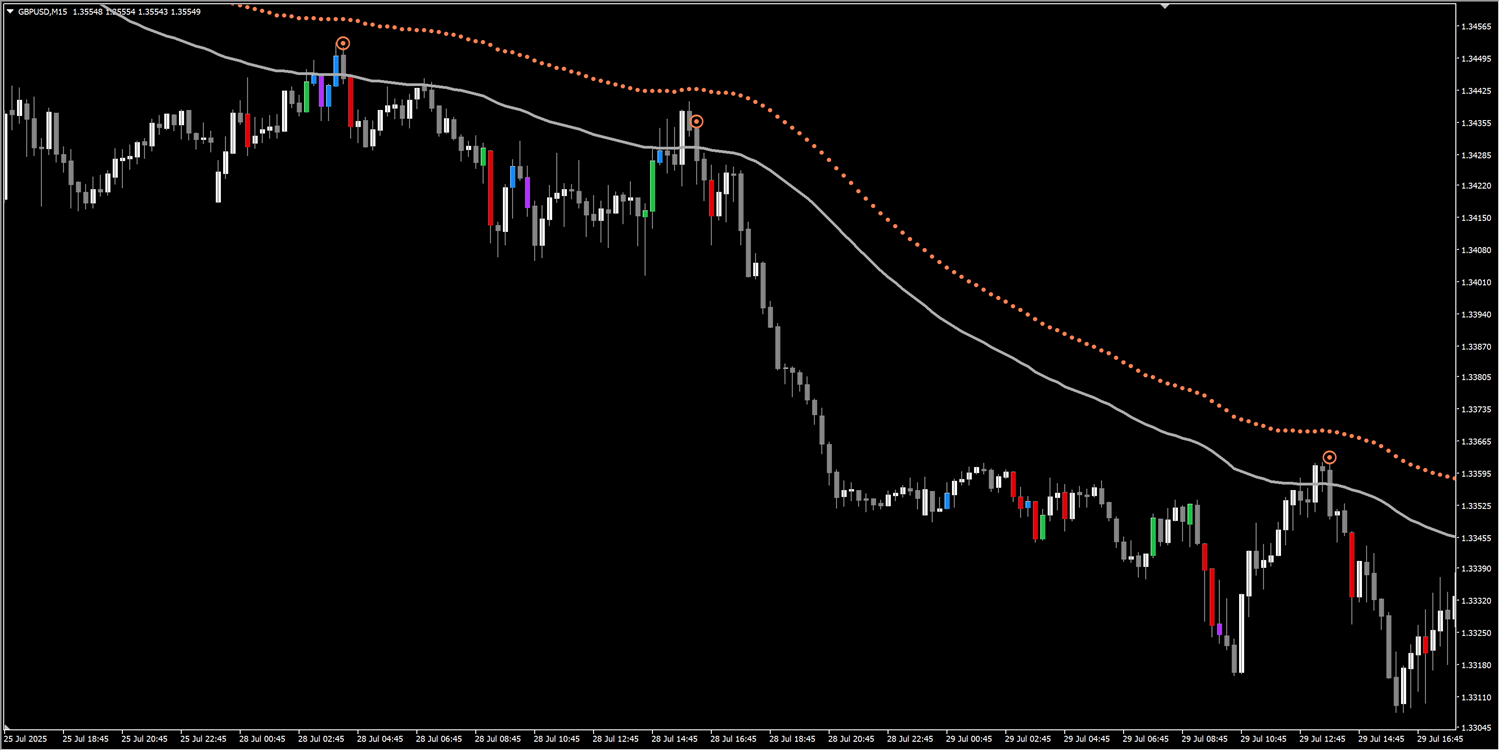
Stops:
If you get a signal when a trend is ending and price is about reverse, it will hit your stop loss despite a good trend slope:
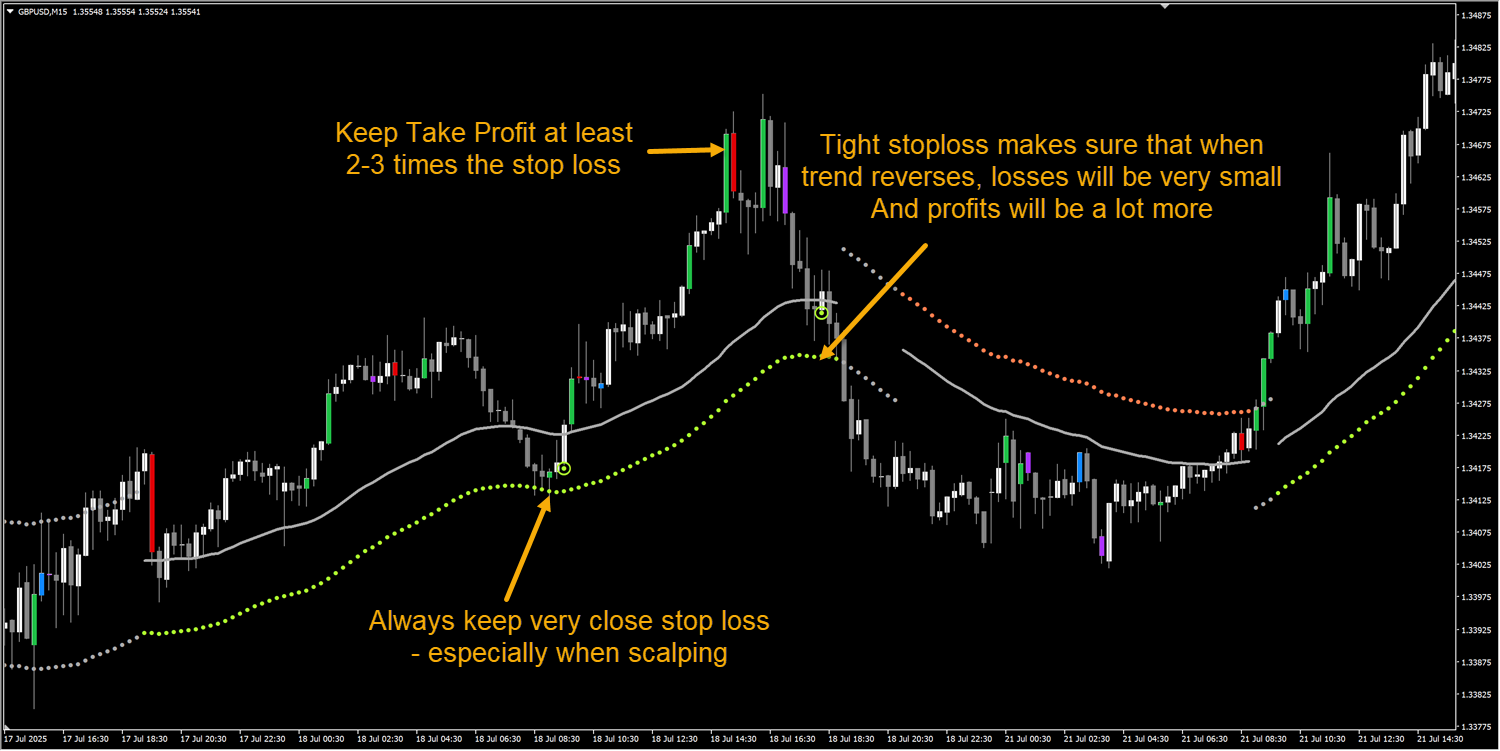
So, keep very close stop loss, just under the green dotted line, or above the red dotted line. And keep Take Profit at least 2-3 times the SL.
If you are quick scalping, the ratio can be 1:1. But still higher TP is recommended.
If you get a signal where price looks like it's already gone too far. So might not get the 1:2 or 1:3 (SL:TP) ratio, avoid such signals:
Example:
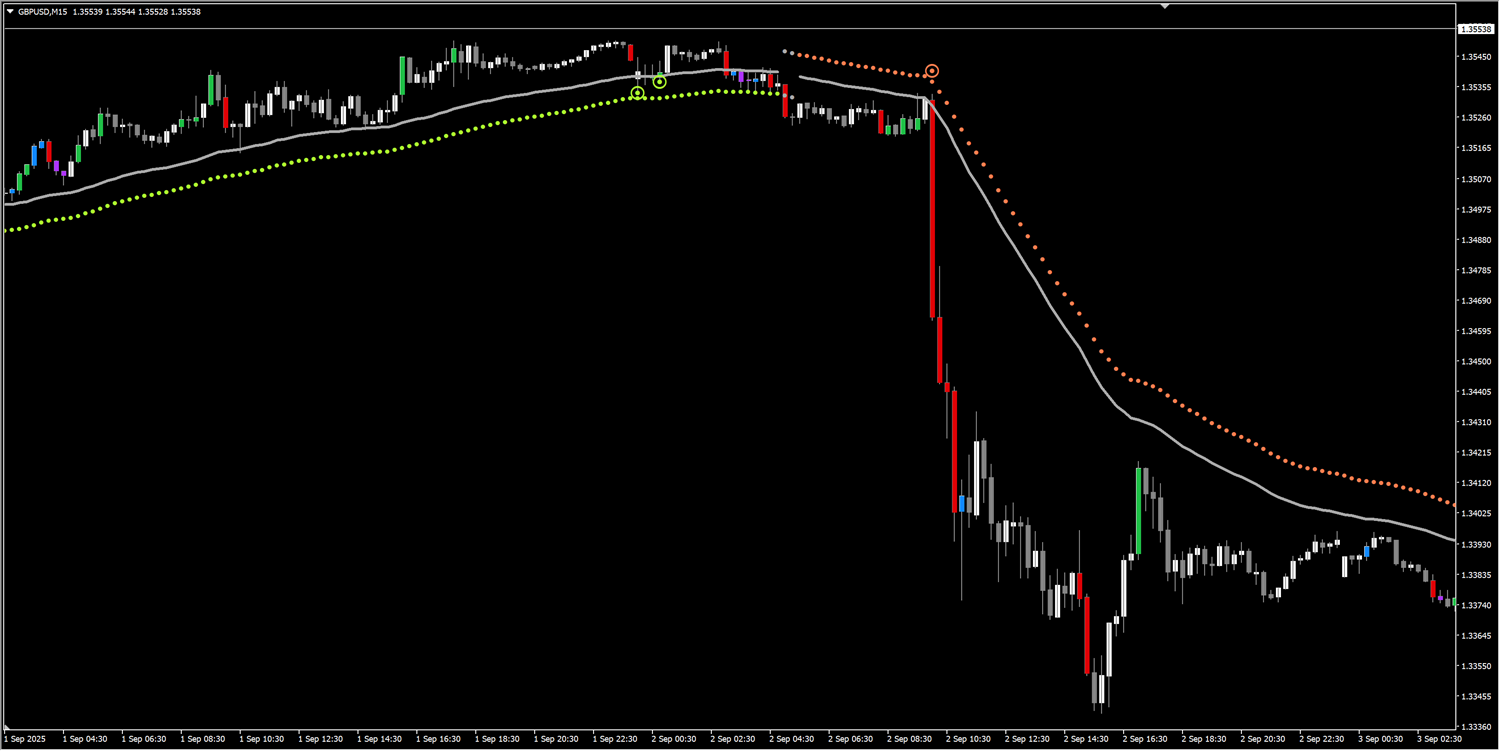
Even though, in the above example, price would have hit 2x TP, but still such signals are risky. Especially during a news event.
So be careful around those.
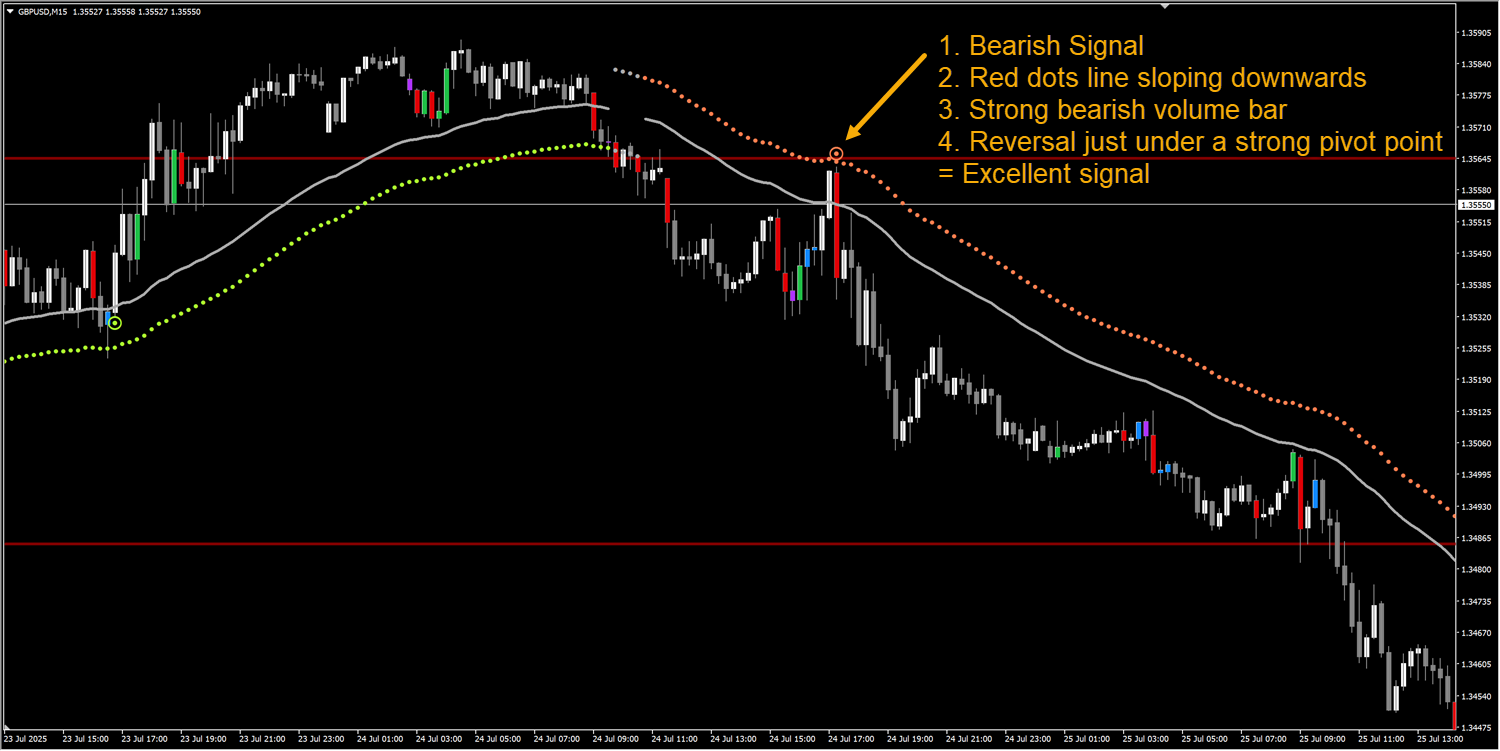
Short Analysis Tips (adds strength)
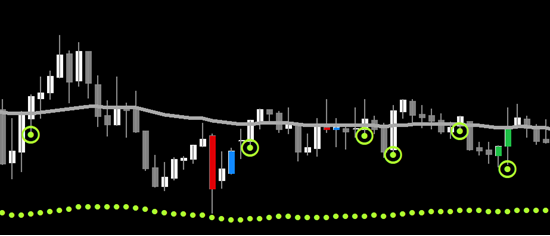
- Volume confirmation: high volume + green dot → stronger buy.
- Support/Resistance: buy signals near strong support or pivot points are stronger.
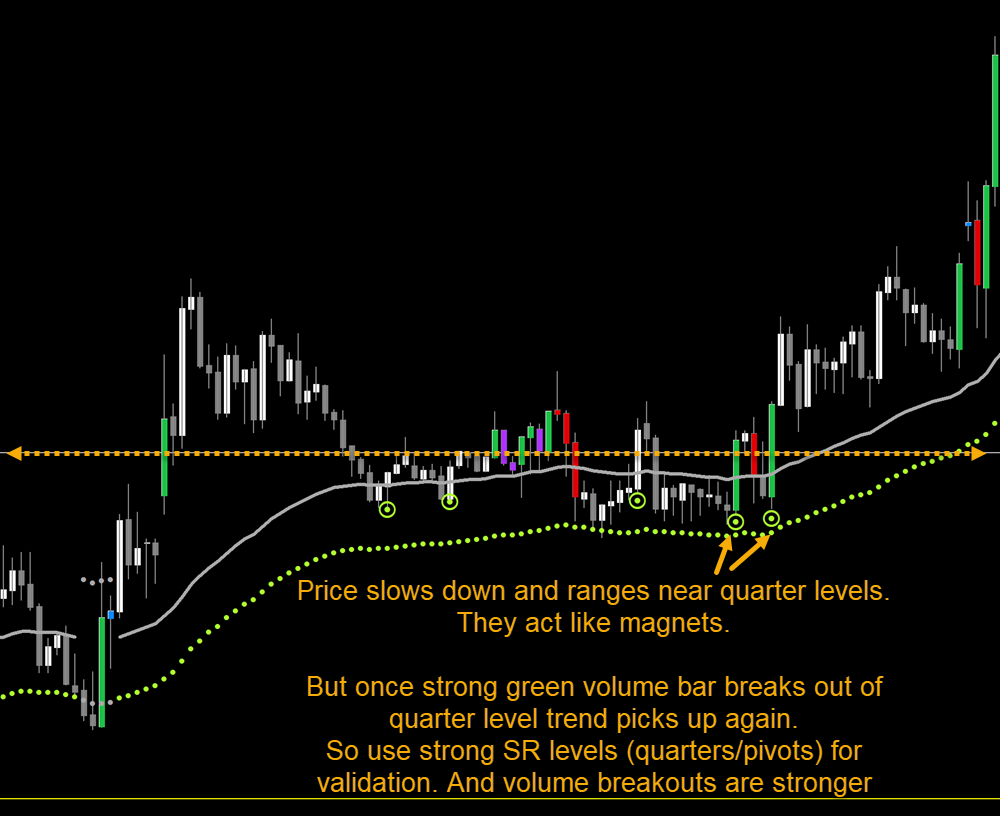
- Pivots/quarter lines: signals near 25%/50%/75% levels add confidence.
- Multiple timeframe match: same trend on higher TF = higher probability. Like comparing H4 trend, before trading on M15 will give you more successful signals.
Example with Volume and Pivot validation:
Calculations (simple)
- Kalman Filter: smooths price using past value and a responsiveness weight (alpha/beta).
- Supertrend: uses ATR around Kalman value to make upper/lower bands and decide direction.
Note: if your historical data is not properly downloaded, then it won't show the bands or arrows correctly. So re-load the indicator on chart after history is properly loaded.
It needs at least 200 bars in past to calculate kalman and supertrend forward properly.
To check, for MT4 go to History Center to make sure enough bars are there. For MT5, go to your Data Folder -> bases -> Broker name -> history
And make sure the history file exists for the timeframe you are trying to load.
All Settings Explained
Kalman settings
- Kalman Alpha: responsiveness. Lower = smoother. Higher = more reactive.
- Kalman Beta: adapts to volatility. Increase in choppy markets.
- Kalman Period: lookback for filter. Longer = smoother.
- Deviation: multiplier for trend bands from Kalman line. Higher = wider distance.
Supertrend settings
- Supertrend Factor: controls band width. Bigger = fewer signals.
- ATR Period: sensitivity of ATR. Lower = quicker changes.
Visual & alerts
- Neutral/Bull/Bear colors: change for visibility.
- Show Arrows: toggle buy/sell arrows.
- Alerts: enable trend or arrow alerts.
Debug
- Show Debug Values: prints internal values in Experts tab for troubleshooting.
- Refresh After Ticks: increase to reduce CPU usage. If you have too many charts open, maybe keep this value to 50 or so.
Debugging (quick)
- If dots don’t match expectations: reload the indicator.
- Turn on debug and watch Experts tab for trend, ktrend, range values.
- Ensure enough history is loaded.
- If performance drops: raise Refresh After Ticks or simplify settings.
Trades to Avoid
- Tight sideways ranges with many gray dots.
- Flat slope even though red/green dots are there
- Trading right after major news spikes.
- Low-volume times (weekends, off-session).
- Going against the trend on higher timeframes (be careful)
Conclusion
Use the indicator to spot trend vs range and to time entries with confluence (volume, SR, pivots). Start with defaults. Test on demo. Adjust Kalman and Supertrend to match your timeframe and pair. Combine signals with volume and support/resistance for better results.
Cheat sheet:
Settings will really depend on your style of trading and the symbol/timeframe you are trading with.
But here is a quick cheat sheet of example settings which will be useful to you:
-
Scalping (fast)
- Timeframe: M1–M15
- Kalman Alpha: 0.01
- Kalman Beta: 0.08
- Kalman Period: 50
- Supertrend Factor: 0.6
- ATR Period: 5
- Deviation: 1.0
- Use: quick entries, tight stops
-
Day Trading (balanced)
- Timeframe: M15–H1
- Kalman Alpha: 0.02 (default 0.01 ok)
- Kalman Beta: 0.10
- Kalman Period: 77
- Supertrend Factor: 0.7
- ATR Period: 7
- Deviation: 1.2
- Use: main preset for most pairs
-
Swing Trading (smooth)
- Timeframe: H4–D1
- Kalman Alpha: 0.05
- Kalman Beta: 0.12
- Kalman Period: 100
- Supertrend Factor: 0.9
- ATR Period: 10
- Deviation: 1.5
- Use: focus on trend strength, wider stops
Please share your best settings with pair/timeframe in comments below. And let me know what you think!


")
")