Quantum Channel Indicator
Logic
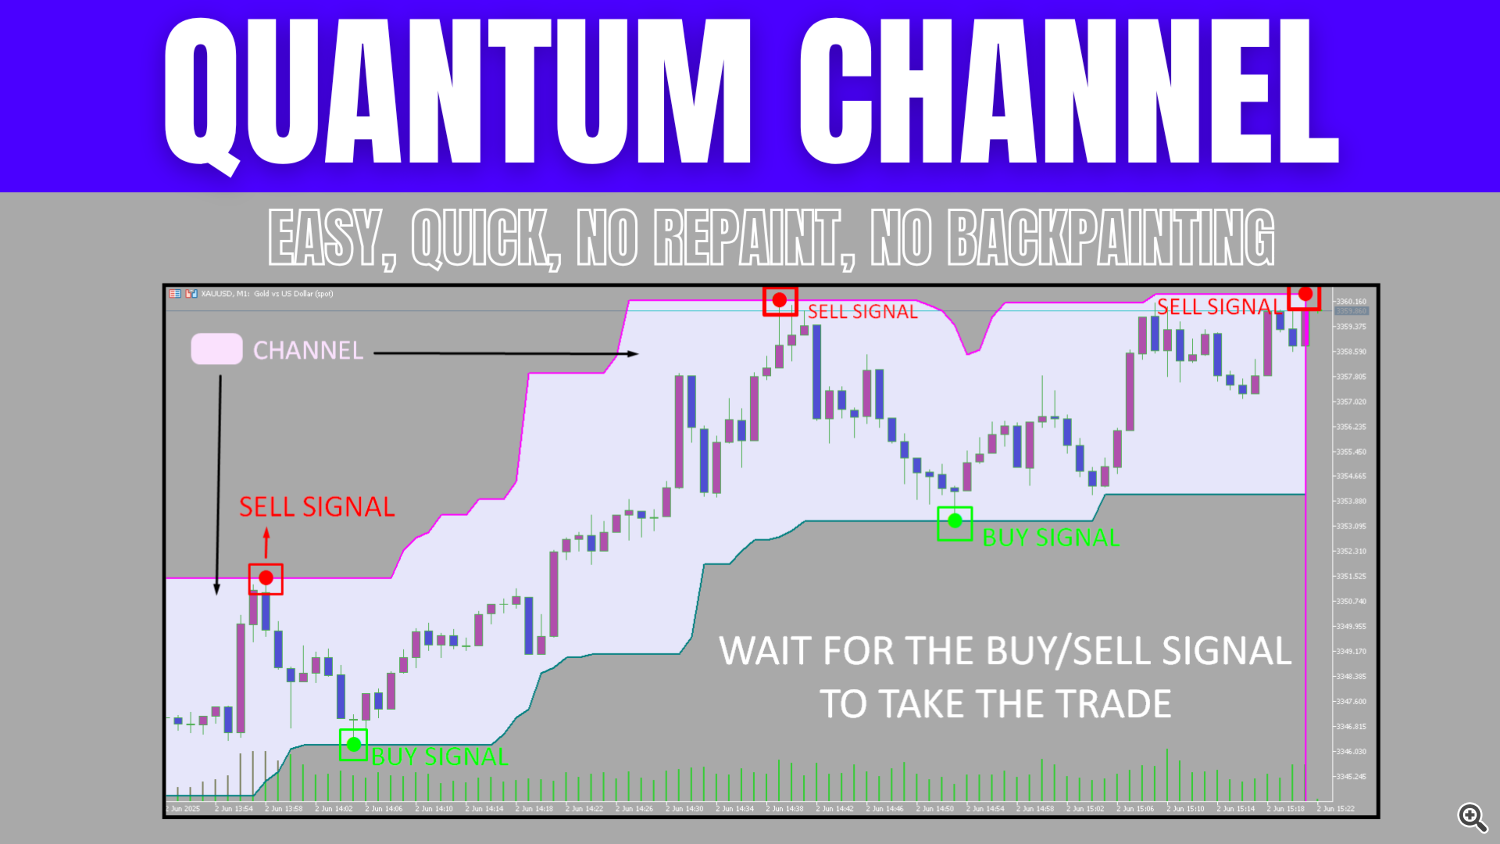
The Quantum Channel calculates upper and lower boundaries based on the highest high and lowest low over a fixed lookback period. It fills the area between these levels as a shaded channel, updating only when a bar closes. This approach ensures that traders see clear price extremes without lagging distortion.
Signals
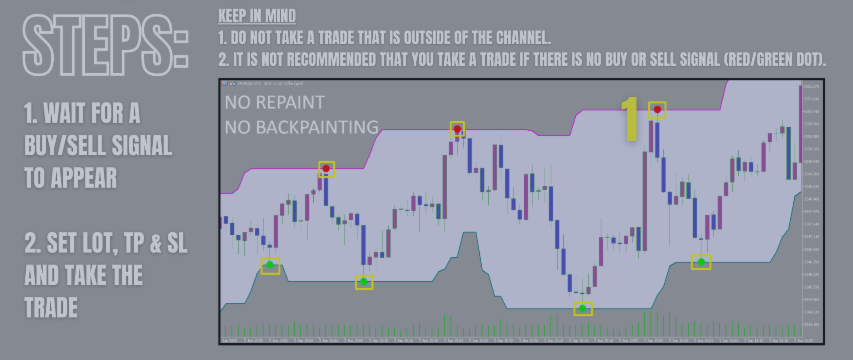
Buy and sell signals appear as arrows when price touches the lower or upper channel boundary, respectively. A green arrow at the lower line indicates a potential long entry; a red arrow at the upper line indicates a potential short entry. These signals rely strictly on closed-bar data, avoiding false triggers from incomplete candles.
Does it repaint?
The Quantum Channel does not repaint on closed bars—once a candle closes, its channel values remain fixed. The indicator omits drawing any levels on the active bar, so there is no backpainting. Signals only appear on the next closed bar, ensuring that historical data is reliable.
Trade Setup
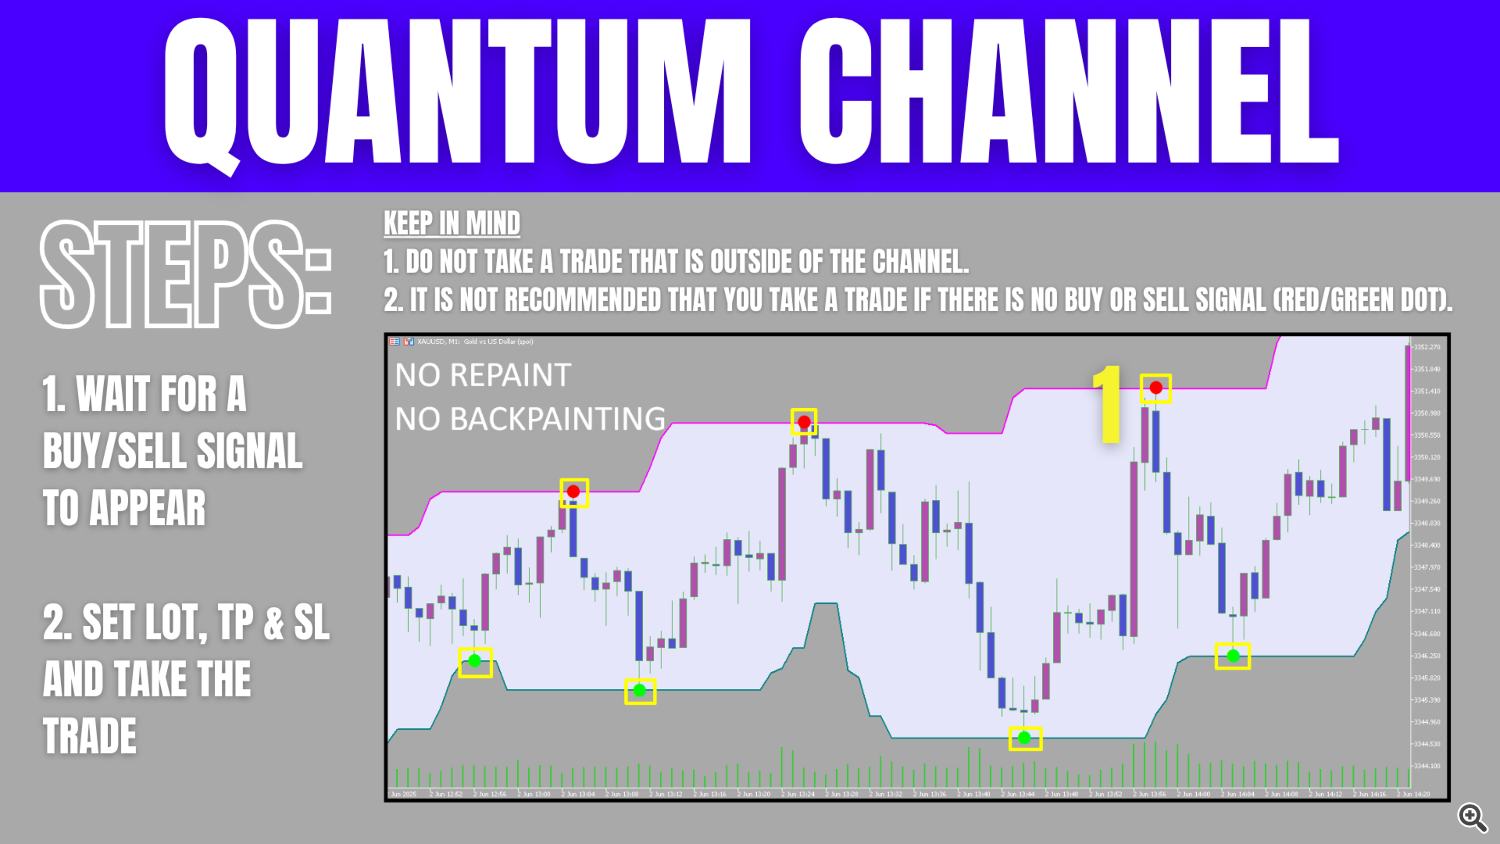
Traders should wait for a confirmed arrow signal within the channel and verify that price remains inside the shaded area before entering.
Place stops just outside the channel boundary and consider targets based on prior channel width or a fixed risk-reward ratio. This discipline helps align entries with defined support or resistance zones.
FAQ
Does the Quantum Channel repaint on historical bars?
No. Once a bar closes, its channel values are locked in. The indicator does not modify past levels or signals, so historical data remains consistent.
How are buy and sell signals generated?
A buy arrow is drawn when the lowest low over the lookback period occurs at a closed bar, touching the lower boundary. A sell arrow is drawn when the highest high over the lookback period occurs at a closed bar, touching the upper boundary.
Can I adjust channel sensitivity?
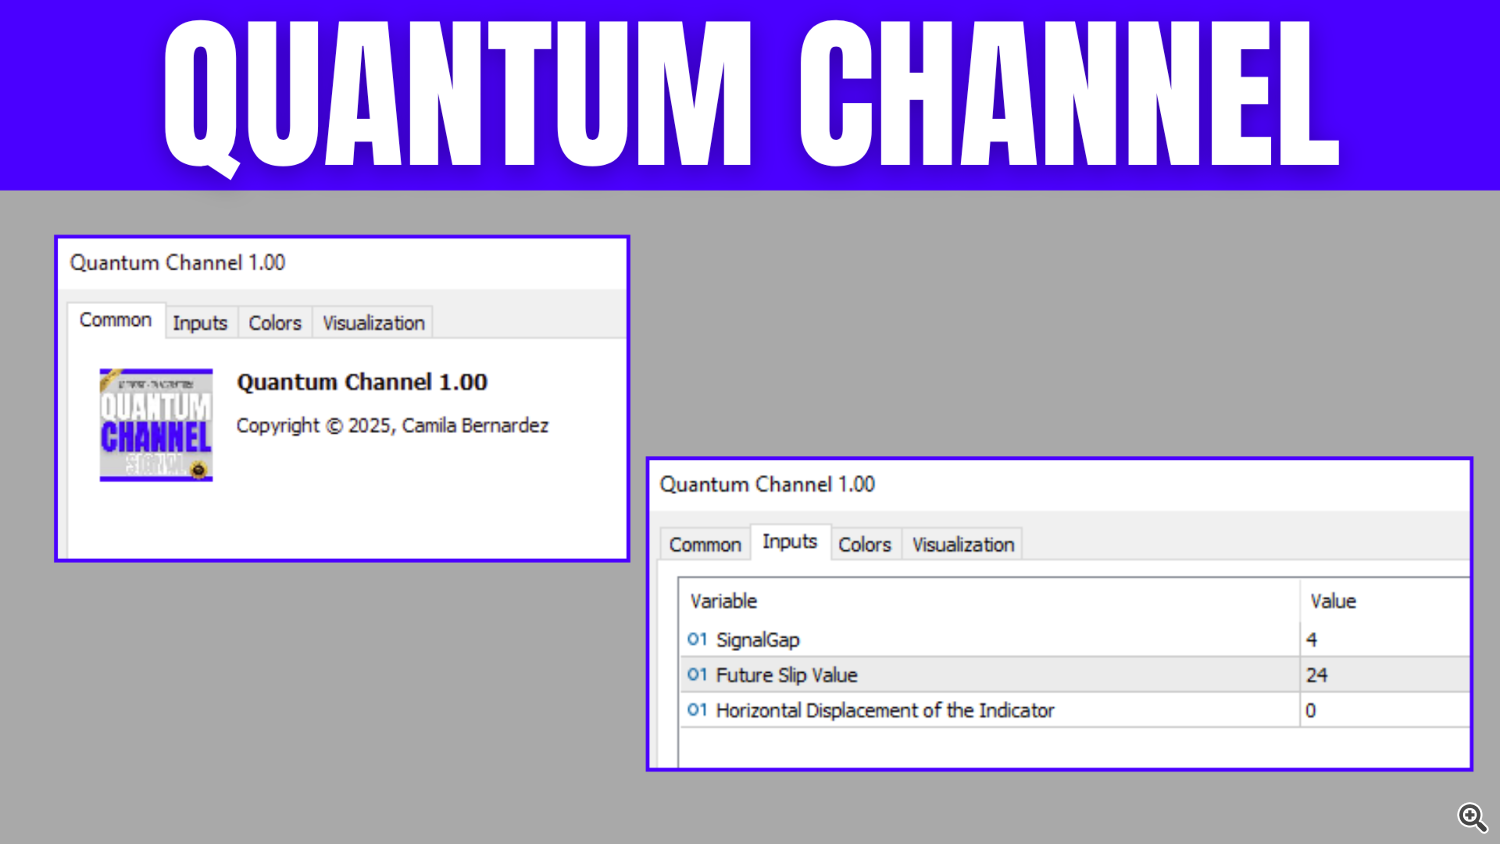
Yes. Change the “Future Slip Value” input to widen or narrow the channel. A larger value creates a broader channel, requiring more extreme price moves to trigger signals; a smaller value tightens the channel for more frequent signals.
What timeframes work best?
The indicator performs reliably on any timeframe but is most effective on 15–60 minute charts for a balance between signal frequency and noise reduction.


