Trading Systems using the RC Soldiers and Crows Indicator

In this blog post I will present you three efective and good strategies you can add to your portfolio using the RC Soldiers and Crows indicator.
YOU CAN FIND THIS INDICATOR IN THE LINKS BELOW:
FOR MT5 (Full version) or for free version, click here.
FOR MT4 (Full version) or for free version, click here.
//-----
Summary:
- 1 Strategy (as a confirmation trend in a Moving Average crossing setup)
- 2 Strategy (as a confirmation signal on a Breakout system)
- 3 Strategy (swing trading on higher timeframes using the inner Moving Average filter)
//-----
# 1 Strategy (as a confirmation trend in a Moving Average crossing setup)
- First, choose any very volatile asset to negotiate, like XAUUSD for example.
- Go to a short timeframe like M5.
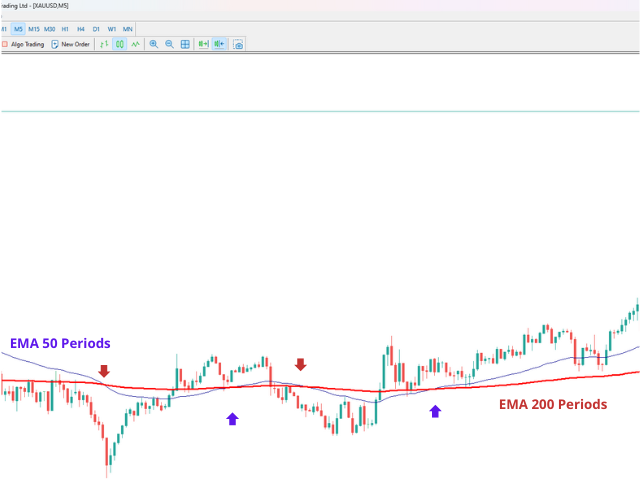
- Add one fast exponential moving average with 50 periods to the chart, then another slow exponential moving average with 200 periods. (image below)
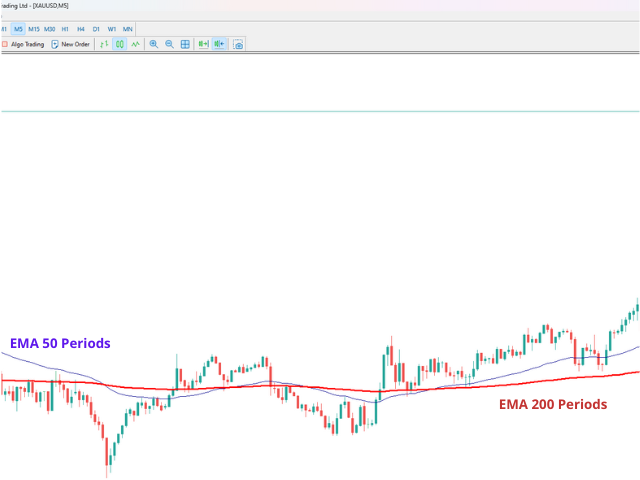
- As you can notice, using a simple "moving average crossing" system can provide many fake signals which might lead to unsuccessful trades that will hurt the trader's account. (image below)
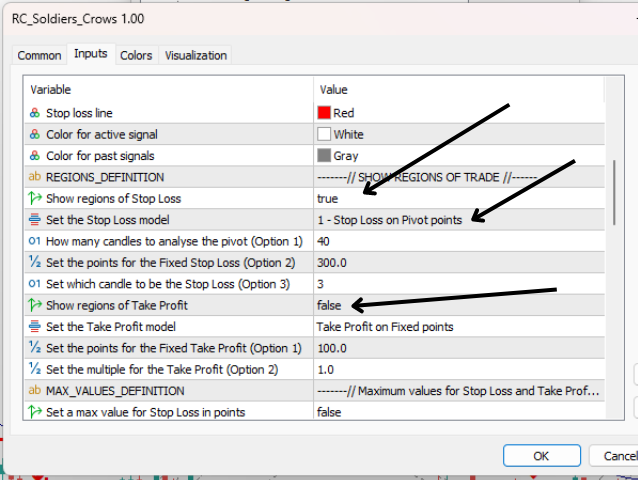
- Now, let's find out how the RC Soldiers and Crow indicator can give powerful insights and good entries to filter those bad signals from the moving averages crossing. First of all, add the indicator to the active chart, then on the "SHOW REGIONS OF TRADE" section set the "Show regions of Stop Loss" true, the "Stop Loss model" to "1 - Stop Loss on Pivot points", finally set the option "Show regions of Take Profit" false. Hit OK. (image below)
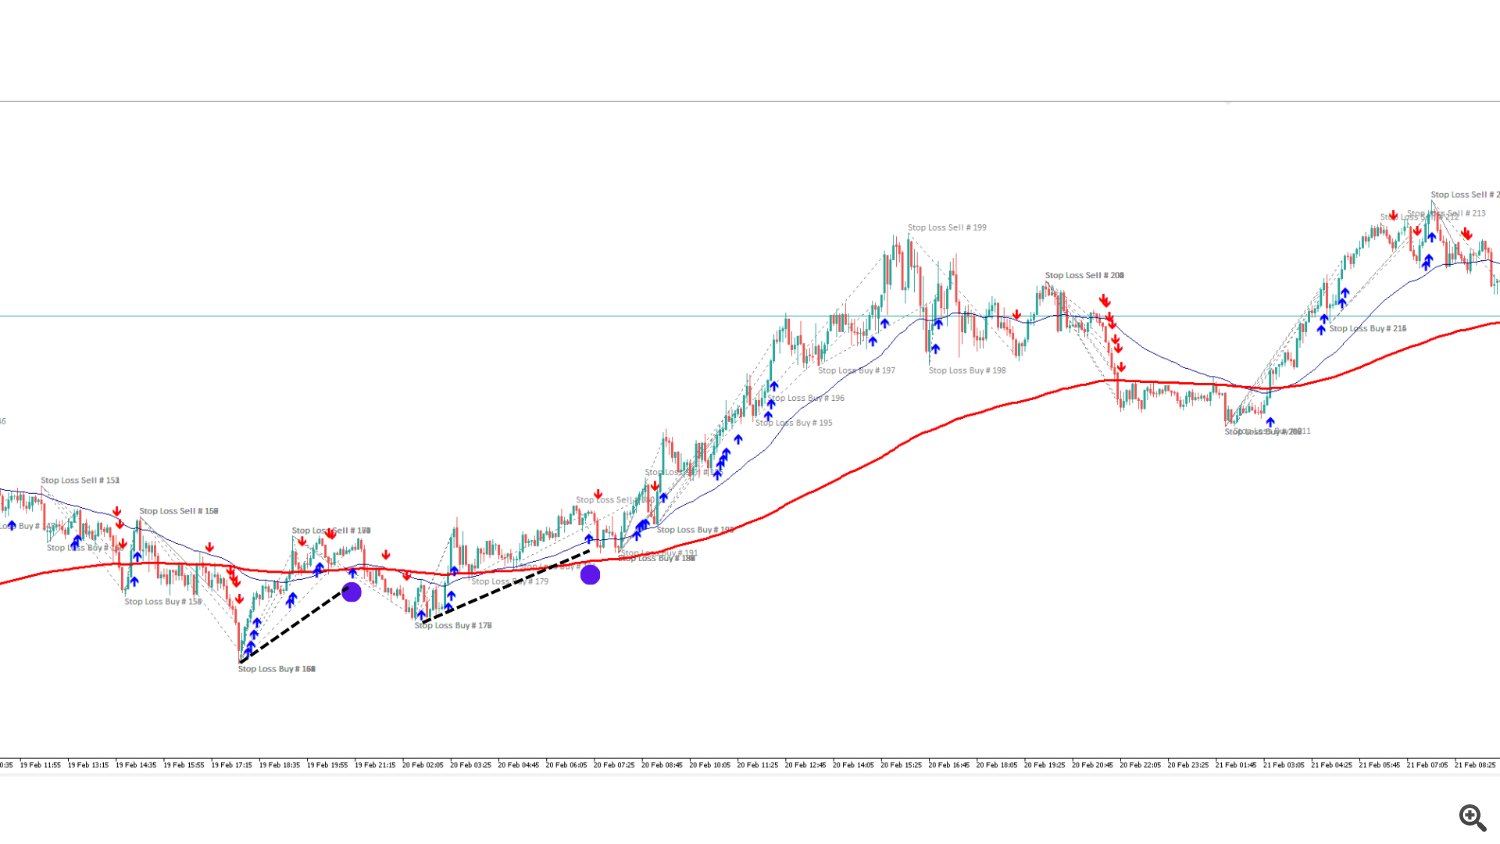
- Now, the Long Position should be opened only when the indicator gives a BUY SIGNAL after an up crossover and check how the indicator offers a good stop loss price based on the recent pivot levels. The same logic about the Short Positions. (image below)
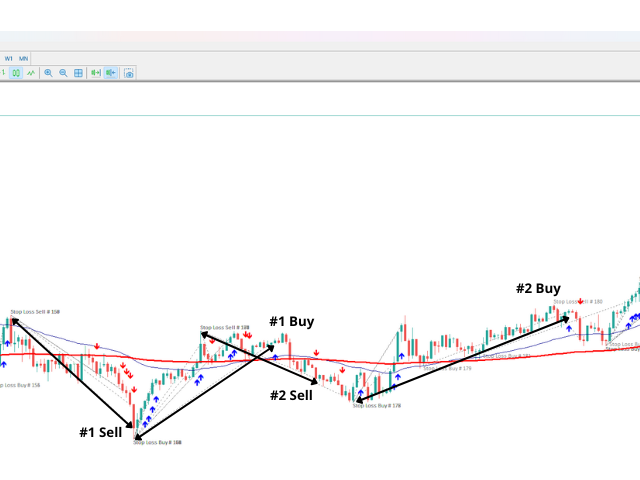
- See on a bigger image how, although some sells would have ended in losses, the next buys (the two blue dots on the chart), with stop losses placed on the pivot levels, would have covered the past losses and offered good profits for the trader. (image below)
So, in short, this first trading system is:
1. wait for a crossover between the two averages defined above.
2. after that, open a position only when the indicator gives a signal after this crossover and in the direction of the trend signaled by the crossing of the faster average in relation to the slower one. For example, if the fast EMA crossed the slow EMA from bottom to top, you will wait for a buy signal from the indicator.
3. Set stop loss at Pivot points for a higher win rate.
//-----
# 2 Strategy (as a confirmation signal on a Breakout system)
- First, find the current main trend, draw a consolidation channel and look for breakouts in the direction of it. (image below)
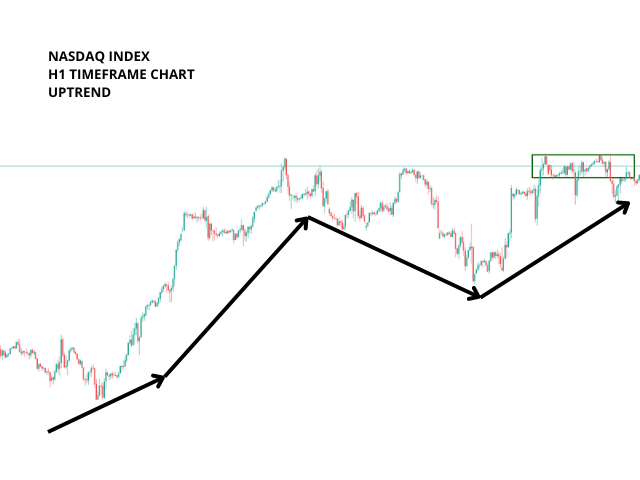
- You will notice that just by trading together with the main trend you would have saved yourself from entering in some bad short trades. Anyway, let's see that "consolidation channel" in a zoomed perspective. (image below)
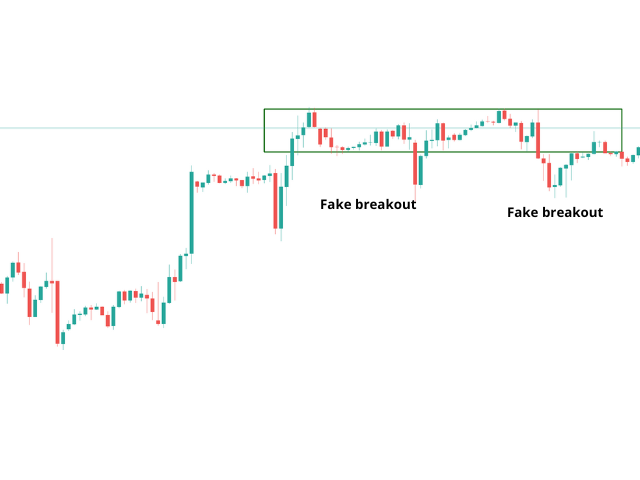
- Now, let's find out how the RC Soldiers and Crow indicator can provide powerful insights and good entries to filter out the bad signals found in Breakout systems and also reveal the price momentum after a breakout in order to confirm the occurrence of a real breakout.
- First of all, add the indicator to the active chart, then on the "SHOW REGIONS OF TRADE" section set the "Show regions of Stop Loss" true, the "Stop Loss model" to "1 - Stop Loss on Pivot points", finally set the option "Show regions of Take Profit" false. Hit OK. (image below)
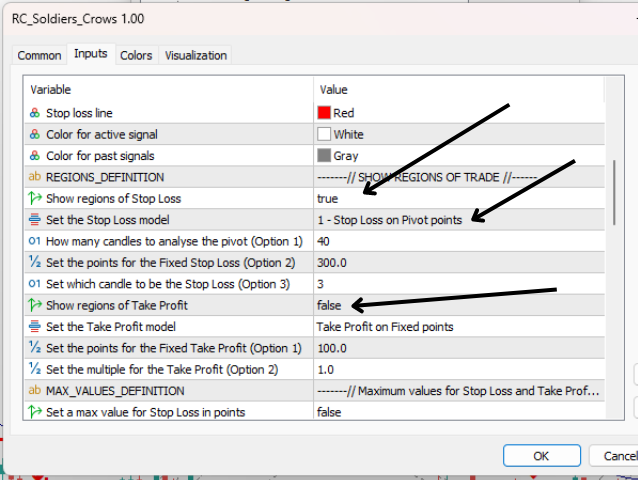
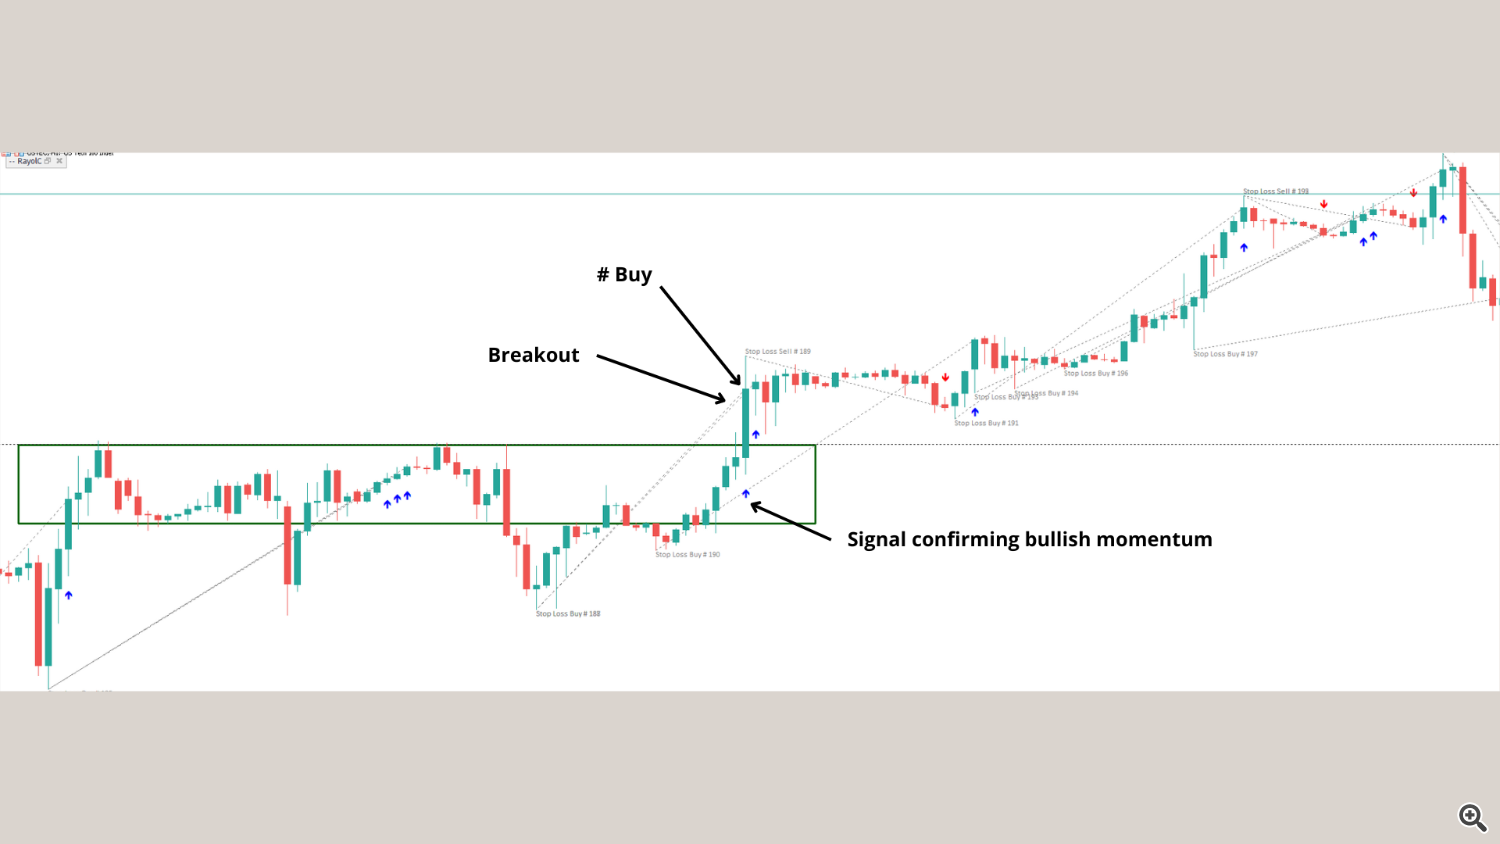
- Now, we can see how helpful the indicator can be by plotting the signals after a breakout occurs. (image below)
So, in short, this second trading system is:
1. find the main trend and draw a consolidation channel in expectation for a breakout.
2. add the indicator to the chart and after a breakout happens in the direction of the main trend, wait for a correspondent signal from the indicator and only then open a position.
3. Set stop loss at Pivot points for a higher win rate.
//-----
# 3 Strategy (swing trading on higher timeframes using the inner Moving Average filter)
- First, best results are obtained if you use this setup in the direction of the larger trend and open orders only in its direction, especially in assets that have a clearly defined fundamental bias such as the SP500, Nasdaq index or even Gold and also on high timeframes charts like H4 or higher.
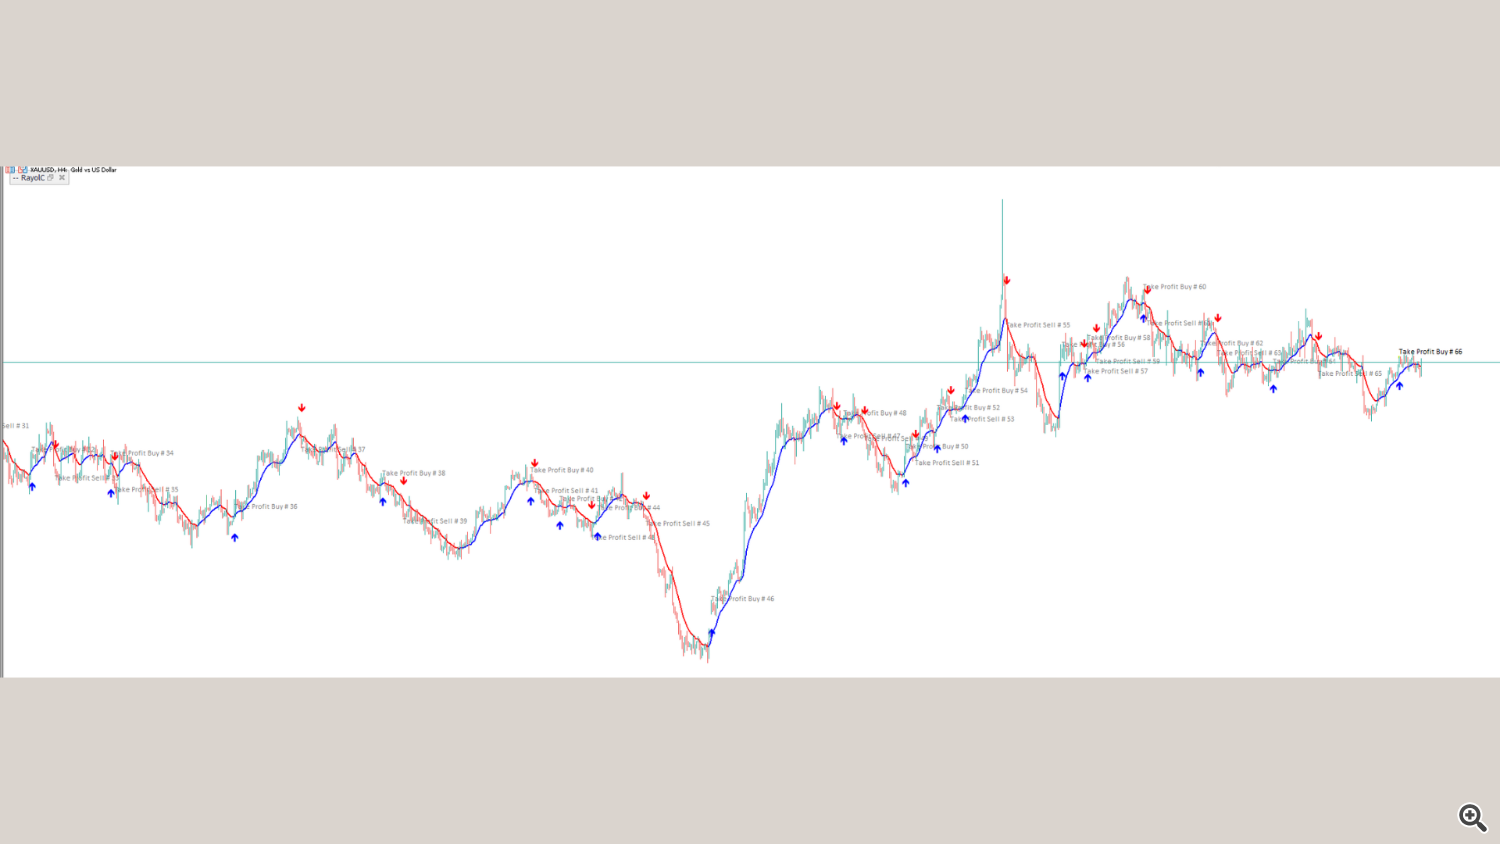
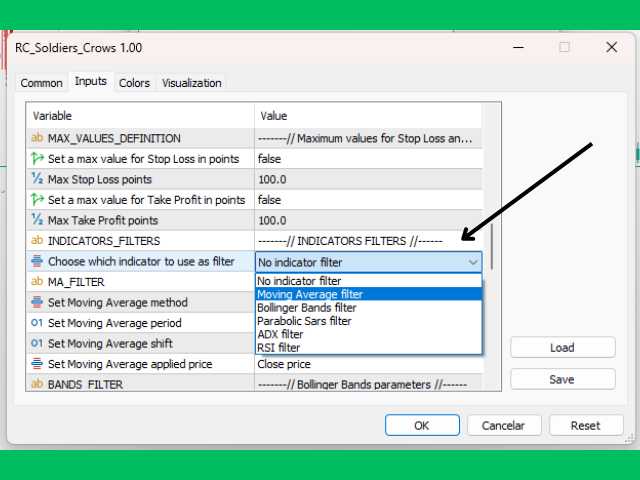
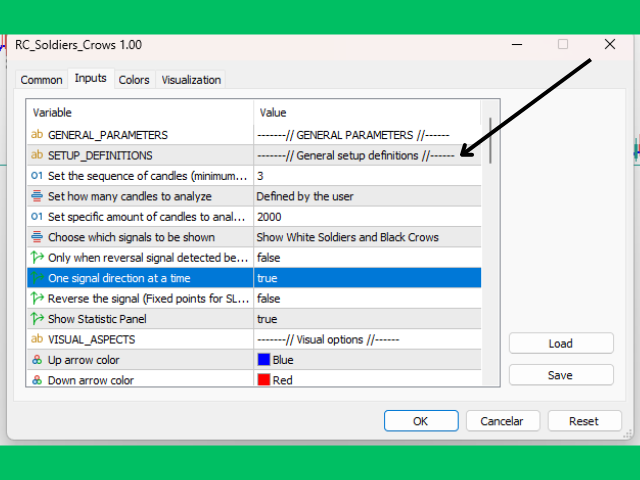
- Now add the indicator to the chart. Use the Moving Average filter, present in the indicator itself. After that, also activate the "One signal direction at a time" option. (images below)
//----
- Open a buy position when the indicator signals it and close it only when a new sell signal appears or vice versa. (image below)
