

Weekly technical and fundamental analysis of gold:
Today is Sunday, December 24th, 2023. If you take a look at the daily chart of the world gold ounce right now, you will notice that the global gold has increased to a very important level of $1970 on its last working day. Gold has had a growth rate of 12.58% in the year 2023 and has also managed to reach its historical peak of $2148 .

In reviewing gold in 2023, it faced sticky banking crises and inflation:
Finally, gold also came under downward pressure in the summer and fell about 6% in a two-month period from August to September.
Geopolitical issues and the dovish tone of the Federal Reserve:
It is true that after this short-lived war, gold again fell to the important level of $2000, but the adoption of a new dovish tone (meaning expansionary policies and interest rate cuts) by the Federal Reserve caused the US dollar to fall and global gold to strengthen again.
The outlook for global gold in 2024:
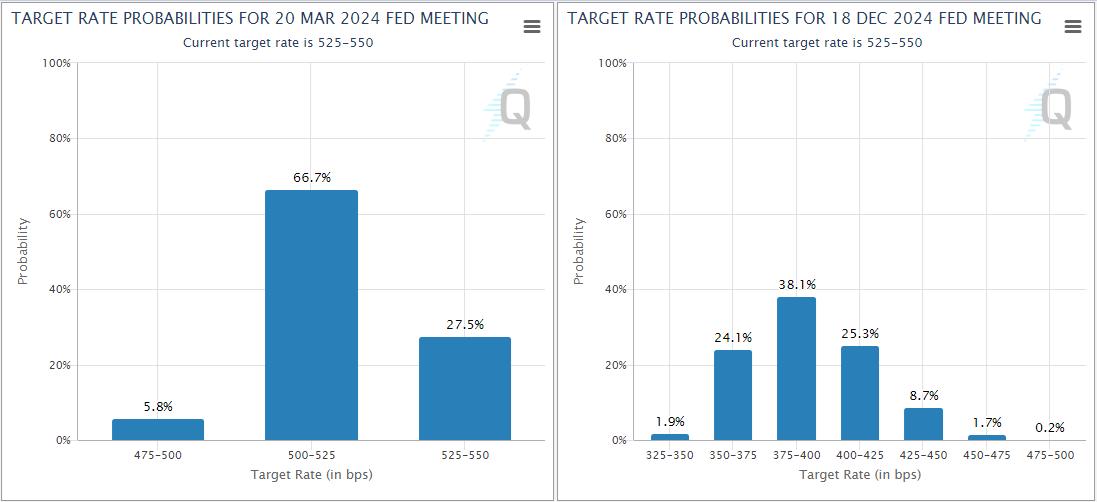
Of course, do not forget that since inventory accumulation was the main driver of GDP growth during that period, seeing a sharp decline in US growth rates in the first half of 2024 will not be surprising at all.
Three Possible Scenarios for Gold Prices in the First Half of 2024:
In this case, with an increase in US dollar bond yields, the US dollar becomes stronger, causing gold to start falling.
Geopolitical Unrest and Uncertainty
US Presidential Election
While worsening relations with China can have a negative impact on the outlook for gold demand, higher tariffs can also make the Federal Reserve's job of reducing inflation to its 2% target more difficult.
China's Economy:

As you may know, China is the largest consumer of gold in the world. Thanks to post-COVID reopening, China's economy renewed its upward trend in 2023.
Meanwhile, Moody's rating agency warned of a downgrade in China's credit rating due to increasing risks related to medium-term structural decline and economic growth, and continued decline in the real estate sector.
Weekly Technical Analysis of Gold:
The RSI indicator on the daily time frame is rising and showing a number of 60. This indicates that gold has maintained its upward momentum and further increases are not unexpected.
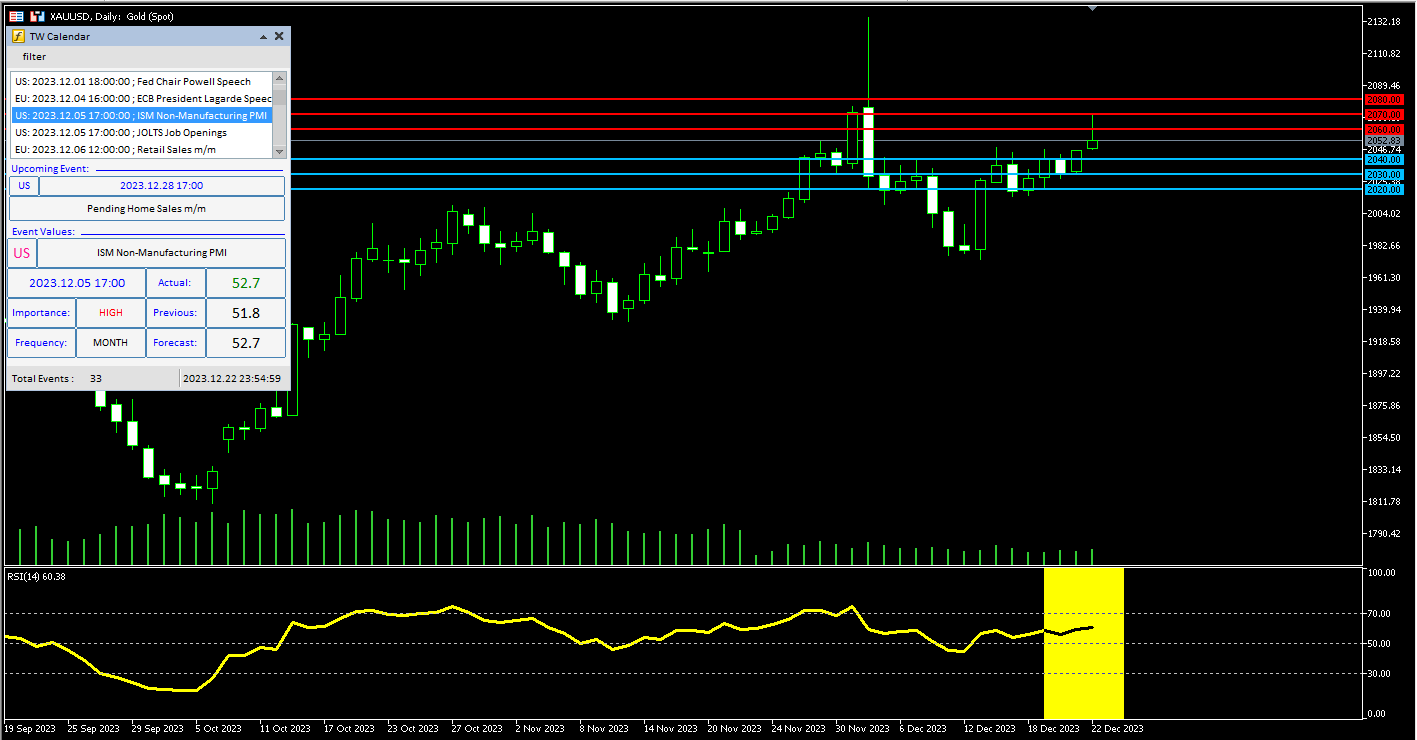
If gold increases, the first important resistance level will be $2060. If market bulls go higher than this area, the next important level will be $2070. Finally, if gold crosses this area as well, the next important level will be $2080.
I hope this review and analysis will be useful and effective along with your own strategy and expertise.




