

High signals settings
In this section, you can see the guide of " High signals" indicator settings
Version Meta Trader 4: https://www.mql5.com/en/market/product/67903
Version Meta Trader 5: https://www.mql5.com/en/market/product/67905
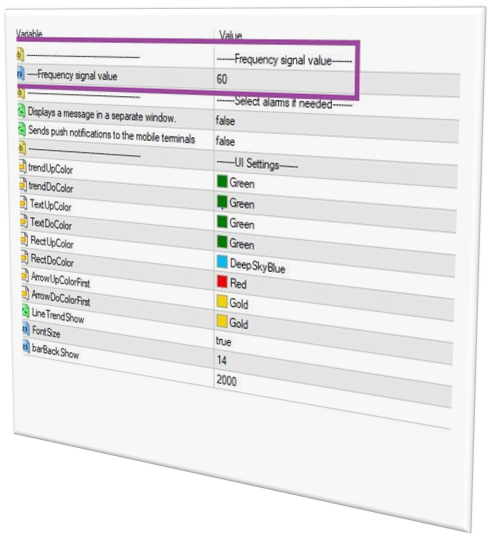
Frequency signal value:
Set the indicator period.
All indicators have a period. Period means the number of candlesticks that the indicator uses for calculations. For example, when the period is equal to 10, the indicator uses the last 10 candlesticks for calculations in the indicator. All indicators have these settings. For example, in the RSI indicator, this number is equal to 14 in the default mode.
In this indicator, the amount of defects is equal to 60.
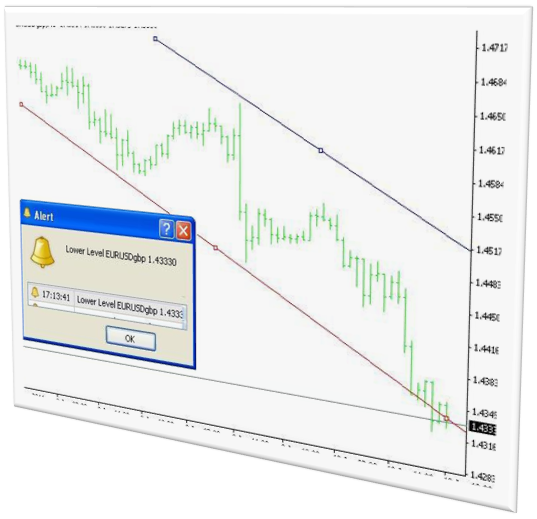
Displays a message in a separate window:
If you enable these settings, you will receive an alarm on the chart when the expert trades
The alerts are intended for signaling about events in the market. Having created alerts, one may leave the monitor as the client terminal will automatically inform about the server event.
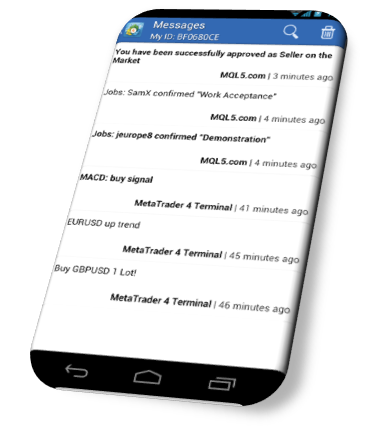
Sends push Notifications to the mobile terminals:
If you enable these settings, you will receive an alarm on your mobile phone when the expert trades
there’s a convenient feature on the Metatrader Platform called “alerts” for desktop or “push notifications” for mobile that allows you to get a notification when the market of your choosing reaches a particular level you are watching.
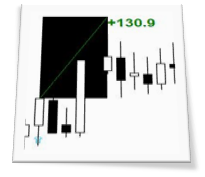
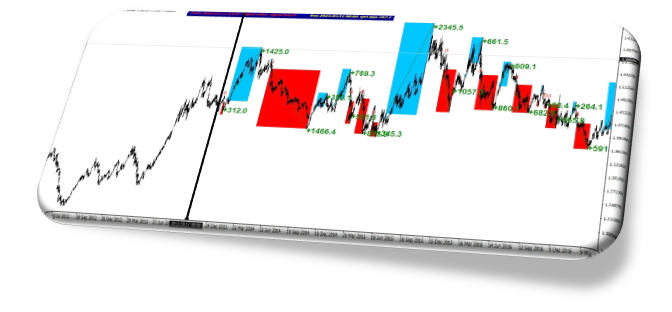
Trend UP color:
Change the color of the blue rectangle diameter (buy signal).
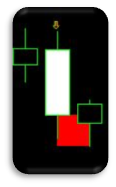
This color is green by default. In the figure below, I changed the color of this line to white.
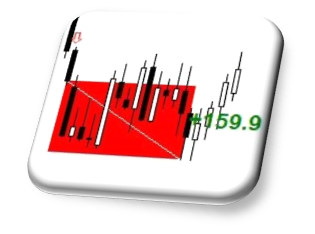
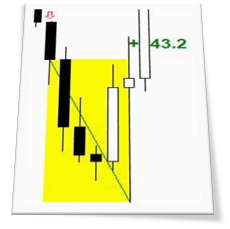
Trend DOWN color:
Change the color of the red rectangle diameter (sell signal).
This color is green by default. In the figure below, I changed the color of this line to white.
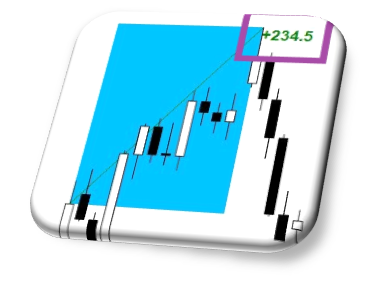
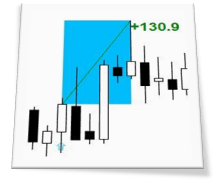
Text UP color:
Change the color of the green text, which indicates the profit of the bullish signals (buy).
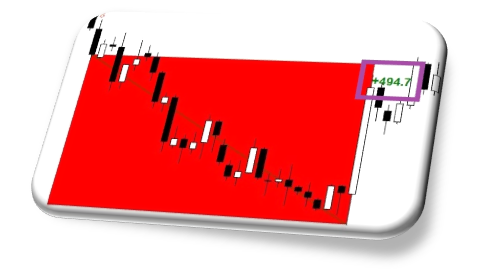
Text DOWN color:
Change the color of the green text, which indicates the profit of the downside signals (Sell).
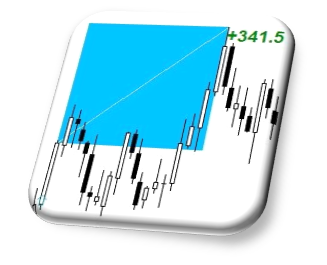
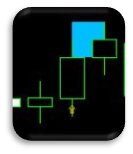
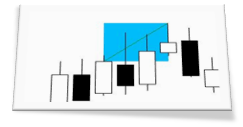
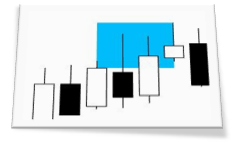
Rect UP color:
Change the color of the blue box.
This box shows an ascending signal from the beginning to the end.
For example, in the figure below, I changed its color to Black.

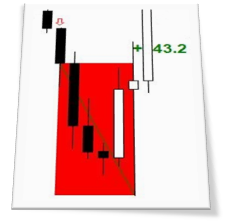
Rect DOWN color:
Change the color of the red box.
This box shows a down signal from the beginning to the end.
For example, in the figure below, I changed its color to yellow

Arrow UP color first:
Change the color of the first up arrow in each signal.
This Arrow indicates an unconfirmed ascending signal.
The color of this arrow is yellow and pale. arrow size is also small.
Arrow DOWN color first:
Change the color of the first down arrow in each signal.
This arrow indicates an unconfirmed descending signal.
The color of this arrow is yellow and pale. arrow size is also small.
Line trend show:
This line is the diameter of the signal rectangles. You can disable these settings in this section.

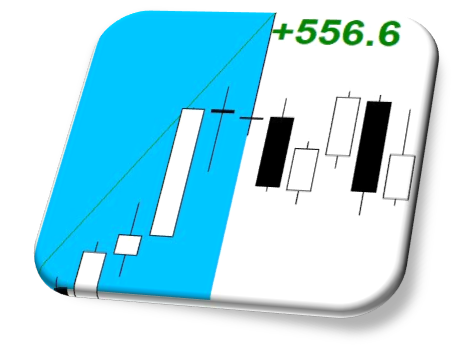
Font size:
Use these settings to resize numbers. In the case of default, this number is equal to 12. In the figure below, I changed this number to 34.
Bar back show:
Adjust the number of candles that the indicator calculates.
The indicator in default mode calculates up to 2000 previous candlesticks and shows it in the diagram. Due to complex calculations, it is best not to overdo this number.


")