Don't trade against the trend!
I think everyone has heard this more than once. But the statistics show something completely different. Most loses his money trying to reverse the market with its opposite orders, naively believing that the trend has already reversed. Therefore, the success of your trading directly depends on how accurately you determine the trend.
So how do you determine whether the trend has reversed or not?
To determine the price reversal, there are many different methods from VSA, Price action, candlestick analysis, trend lines, levels, movings, waves, channels, indicators, trained neural networks, news, fundamental analysis, stars :) and so on.
In this article I will talk about the indicator Smart trend line, which combines several techniques at once. These are Price action, candlestick analysis, levels, channels, movings and a unique mathematical algorithm for filtering the result in one ready-made indicator. Which, with a minimum number of settings, shows excellent results on history.
Indicator Smart trend line became the embodiment of several of my developments, taking only the best. An important advantage of the indicator is the minimum number of settings and the possibility of optimization on the existing history of a currency pair directly in the MT4 or MT5 terminal, without using the strategy tester.
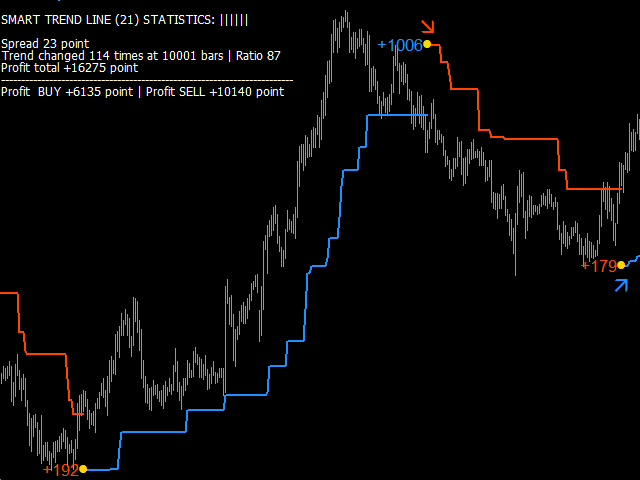
Smart trend line indicator with a panel of statistics of profitability

How to choose the right timeframe for trading and set up the indicator Smart trend line ?
- Place the indicator on the chart of the currency pair. The statistics you need to configure will be displayed in the upper left corner. Enable if necessary "Trend change statistics" in the indicator settings.
- Switching terminal timeframes from M1 to D1, find the timeframe on which the profit indicators "Profit total" according to statistics, the maximum.
- Of the two profitable timeframes, choose the one on which the profit in the purchase "Profit Buy" and on sale "Profit Sell" is positive and of the same order.
- If there are no profitable timeframes, change the indicator period "Indicator period" one of the numbers of the Fibonacci series 8,13,21,34,55,89,144 and repeat the procedure for choosing the timeframe with the highest profit, or change the currency pair to another.
- Now that the optimal tamframe for the pair is selected, adjust "Indicator period" about the original value, adding 1 to the period and subtracting 1. Find the closest value "Indicator period" with the maximum profit value.
- Now forward test. Set the "History bars" value to 1000 and make sure that on a smaller part of history, the selected settings still give profit on buying "Profit Buy" and selling "Profit Sell". If the profit has disappeared, repeat everything from the beginning on other settings.
- Congratulations, now you have found the most profitable timeframe and set the most optimal indicator settings for this currency pair .
The foreign exchange market is volatile and the settings that worked yesterday could be a loss tomorrow. Therefore, the optimization procedure must be periodically repeated by adjusting the indicator period.
You can check the indicator and try its optimization on any currency pair in the strategy tester, by downloading the demo version of the indicator.
I will be glad to answer your questions. All success in trading.


