

First, a review of last week’s events:
- EUR/USD. The latest US employment data is not just optimistic, but over-optimistic: approximately 4.8 million people returned to work in June. The unemployment rate fell from 13.3% to 11.1% - the best increase in employment outside the agricultural sector since records began in 1939.
So what? Nothing! The market has almost stopped responding to macroeconomic indicators as it has new, outperforming indicators: the number of newly infected COVID-19 and the number of dead from this virus. And here the United States far surpassed both Europe and China. As a result, the American economy is in a vicious circle: the more employment, the more newly opened businesses, the more people went to work, began to visit restaurants, travel by bus and subway, the more ... newly infected with the coronavirus. The number of such only on Thursday July 2 was 57 thousand - an increase of almost twice as much as at its peak in April.
Things are significantly better in China and Europe, and so they can relaunch their economies more actively. The United States, on the contrary, will be forced to slow down this process. Positive statistics for July may be the peak, followed by a new fall. But the US will need, according to the congressional Budget office, at least ten years in order to return to the level of unemployment that was before the pandemic (3.5%).
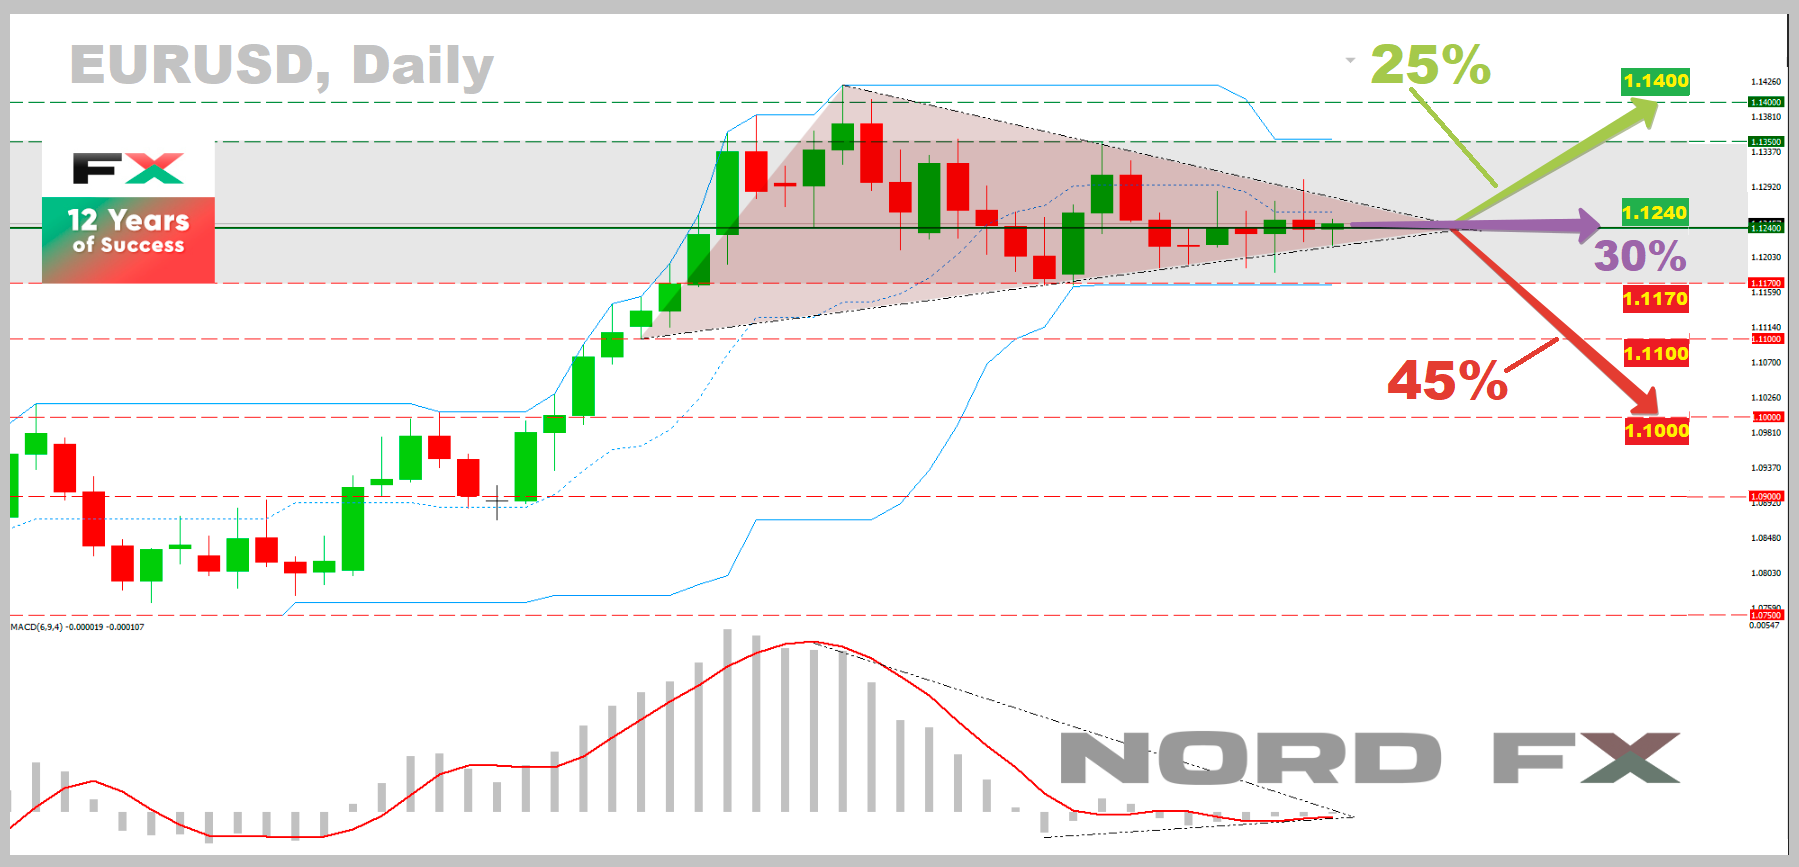
In the absence of other drivers for decision-making, the market is at a crossroads, expecting how the situation with COVID-19 will develop further and what measures the US leadership can take to deal with the new wave of the pandemic. This inability of investors to take any direction was reflected in expert forecasts. Recall that last week their opinions were divided almost equally: 30% voted for the pair's growth, 40% for its fall and 30% for the side trend. At the same time, the boundaries of the channel on which it moved the whole second half of June — 1.1170 and 1.1350 were named as the main levels of support and resistance. In reality, volatility was even lower, the pair did not go beyond 1.1185-1.1300, and ended the week at 1.1245 - almost at the same Pivot Point 1.1240 along which it moved back in March 2019;
- GBP/USD. Was it a temporary correction or a reversal of the June 20-day downtrend? Negotiations on the post-Brexit period are, according to a number of experts, going well and it looks like the EU is ready to make concessions on the jurisdiction of the European Court of Justice. This inspires investors with a certain optimism about the future of the British currency, which is reflected in its quotes: the pound is growing in relation to the euro and the dollar. The GBP/USD pair found a local bottom at 1.2250 on Monday, June 29, after which it steadily went up, reaching a high of 1.2530 on Thursday, July 2. The final chord sounded at around 1.2480, which allowed the pound to win back 145 points from the American currency in a week;
- USD/JPY. Japan's State Pension Fund (GPIF), the world's largest management company in this sphere, announced record losses for the first quarter of 2020, which amounted to ¥17.7 trillion ($165) billion). The structure of its losses allows us to draw some analytical conclusions. So, GPIF lost 22% (¥10.2 trillion) on investments in shares of foreign companies, 18% (¥7.4 trillion) on investments in the Japanese stock market and only 0.5% (¥185 billion) on investments in Japanese government securities. Due of the pandemic, the American S&P500 index fell by 20%, the Japanese Topix slightly less — by 18%, the yield of ten-year US Treasuries over this period fell by 125 basis points, and here the yield of similar government securities in Japan increased by 3 bps. The yen also strengthened in the first quarter – by 1% against the dollar, and by 3% against the Euro. These figures are quite eloquent about which Japanese assets can be considered a real haven.
As for the behavior of the pair USD/JPY in the past week, there were no special events: the yen and the dollar continue to struggle with varying success for the funds of investors who do not want to risk, as a result, the pair continues its movement along the Pivot Point in the 107.50 zone. That's where it ended the trading session;
– cryptocurrencies. According to estimates by British investment firm Buy Shares, bitcoin has bypassed the world's leading indices by an average of 70 times over the past five years. During this period, investments in the main cryptocurrency could bring more than 3400% profit. At the same time, the NASDAQ index rose 96 percent. The S&P500 index, whose basket includes 505 selected companies traded on US exchanges, showed even lower returns – 46%. The Dow Jones industrial average has a similar result – 42%. The worst result from the above was shown by the leading index of the British Stock Exchange FTSE100 - from June 2015 to the present day, its quotes fell by almost 7%.
However, past merits of bitcoin are not at all a guarantee of merits in the present and future. The main cryptocurrency continues to move in the narrow range of $9,000-10,000 for the seventh week in a row. Such sideways trends have repeatedly ended in a collapse. So, bitcoin dangerously pressed to the lower boundary of the channel all last week, not rising above the horizon $9,285. Moreover, the bears made several breakout attempts, during which the price of BTC fell to the $8,840 mark, which gave investors a lot of unpleasant feelings. Such dynamics cannot please the miners working after the May halving at a loss either.
Despite the above figures of staggering bitcoin returns, analysts are increasingly talking about the correlation of this cryptocurrency with the stock market. Against the backdrop of alarming expectations of a new wave of a pandemic in the United States, stock indices moved to the red zone at the end of the week: investor risk appetites are disappearing. Accordingly, their interest in bitcoin is falling. Crypto market capitalization is virtually unchanged: $266 billion on June 19, $263 billion on June 26, $260 billion on July 03. (Note that the crypto market showed the same volumes exactly two years ago, in June-July 2018). The Crypto Fear & Greed Index is also behaving sluggishly: its arrow is at 41 (39 on June 19 and 40 on June 26).
Now about the altcoins. The total number of all kinds of crypto coins today is a gigantic figure, 5687. Bitcoin dominates the market, covering 64.4% of its volume. It is followed by Ethereum (ETH) with 9.70%. Demand for this coin is fueled by the promises of its creator, Vitalik Buterin, to increase network bandwidth to 100K transactions per second. The next most popular bypassing the Ripple turned out to be the Tether stablecoin (USDT), which shows positive dynamics in moments difficult for the cryptocurrency market. The capitalization of the USDT at the end of the past week was 3.55%, while the capitalization of the Ripple (XRP) was only 3.04%.
***
As for the forecast for the coming week, summarizing the views of a number of experts, as well as forecasts made on the basis of a variety of methods of technical and graphical analysis, we can say the following:
- EUR/USD. No particularly important economic events are expected in the coming week. The number of new applications for unemployment benefits in the United States, as well as some data on ISM business activity in the services sector in this country, and industrial production in Germany will become known. However, most likely, they will not be able to shake the market much. Due to the fact that all interest rates are about zero, the spreads of bond yields have almost nothing to react to either. And, as has already been said, the reaction of investors to the news about COVID-19 will most likely be affecting the behavior of the EUR/USD pair.
There is another interesting factor that can affect the dollar, it is the results of the US presidential election, which will determine the further economic policy of the country. But it is still four months away, and a serious recovery should be expected only when autumn starts. Although Donald Trump is known for his ability to present the most unexpected surprises at any moment. However, this "parameter" is almost impossible to predict.
It is not worth focusing on the indicator readings with this behavior of the EUR/USD pair in recent weeks, and it is almost impossible, since their main color on both H4 and D1 has become neutral gray. Graphical analysis refuses any constructions as well. But among analysts, the belief in the dollar still dominates. So, 45% of them voted for its growth and reduction of the EUR/USD pair, first to the lower border of the channel 1.1170, and in case of its breakdown - another 70-100 points below. 25% of experts expect to see the pair at a height of 1.1400, and the remaining 30% predict the continuation of its consolidation in the region of Pivot Point 1.1240;
- GBP/USD. So, let's repeat the question asked in the first part of the review: "Was it a temporary correction or a reversal of the June downtrend?» Graphical analysis on H4 confidently answers: “A reversal” and draws a further rise of the pair to the high of June 10 at 1.2810. On D1, the forecast is somewhat different - first, a decline to support 1.2245, then a return to the level of 1.2480.
The vast majority of trend indicators (90%) and oscillators (85%) on H4 are painted green. On D1 there is no such solidarity: here priority is given to gray neutral, and 15% of oscillators signal the pair is overbought.
As for analysts, they will first of all wait for the results of the next round of negotiations on the terms of the UK's exit from the EU. In the meantime, 30% of them believe that the pair will move within the lateral corridor 1.2245-1.2680, in the central zone of which it completed the previous week. Another 20% expect it to rise to a height of 1.2810, and 50% of experts expect the pair to decline to support 1.2160, and then 100 points lower;
– cryptocurrencies. The gurus of this market, as usual, raise their heads to the stars, predicting bitcoin's cosmic takeoff. The June issue of Crypto Research Report presents a forecast that the price of BTC could approach $400,000 in the next ten years. Top altcoins, Ethereum (ETH), Litecoin (LTC), Bitcoin Cash (BCH) and Stellar (XLM) will also significantly increase the price. “We believe bitcoin is at the very beginning of its acceptance curve,” the report said. “The $7,200 price at the end of 2019 indicates that BTC is present at less than 0.44% of all of $212 trillion markets. If this penetration reaches 10%, its cost should be almost $400,000.” This will mean an increase in the price of BTC by 2030 by more than 4000%. ETH, LTC and BCH in this scenario also look extremely optimistic, showing gains of 1600%, 5000% and 5400%. The largest growth should be shown by XLM, over 11,000% (from $0.07 to $7.81).
An even higher cost of Bitcoin is predicted by the TV presenter and founder of Bitcoin Capital, Max Kaiser. Recall that he began to promote this cryptocurrency when it cost only $1, and now Kaiser suggested that the price for a coin could reach $500,000. However, this requires “just a little thing” - the US mining war with Iran and Venezuela for hashrate. According to the TV presenter's calculations, Iran controls 3% of the world's hashrate, and Venezuela could soon gain control of 3 -5% of the hashrate, forcing the US into the race for mining, and will lead to an increase in the price of the main cryptocurrency.
However, the near future does not look as rosy as Max Kaiser would like. We have already said that in the eyes of large institutional investors, bitcoin was, is, and will remain for a long time a risky asset, following such stock indexes as the S&P500. And in the near future, according to analysts at JP Morgan, pension funds can liquidate their assets in shares worth $ 175 billion, which will work like a trigger, causing a wave of sales in the stock and cryptocurrency markets.
None of the experts sees the BTC/USD pair above the $9,000 mark in the coming week. 40% of experts expect a continuation of its sideways trend in the range of $ 9,000-10,000. Most analysts (60%) believe that the pair will fall into the $ 8,000-9,000 level.
In the transition to the medium-term forecast, the number of bulls’ supporters rises to 55 -60%. So, for example, Bloomberg analyst Mike McGlone thinks the price of BTC could rise to $13,000, and even close to the critical $20,000 mark by the end of the year. After that, according to the expectations of many experts, there will be a massive closure of long positions and an impressive rollback of the pair down.
NordFX Analytical Group
Notice: These materials are not investment recommendations or guidelines for working in financial markets and are intended for informational purposes only. Trading in financial markets is risky and can result in a complete loss of deposited funds.


")
![[XAUUSD]: Weekly Liquidity Activation Points (timings), June 22-26, 2026](https://c.mql5.com/6/1013/splash-preview-771790.png "[XAUUSD]: Weekly Liquidity Activation Points (timings), June 22-26, 2026")
")