

Two BD% Color tricks you should Know
Colors setup might not look as an important thing for automatic trading, because your expert advisor is not interested in the color of your buy or sell arrows as it is interested only in generating profits from them. But when you trade manually it is a different story, because the colors of our chart affect our eyes and emotions. If you feel bearish about a pair of currency it will be more suitable for you to use a light rosy background, and if you feel bullish then a light green background might be much more sensible for you.
Take a look at the next candle GBPUSD charts and tell me do it looks wise for you to see the bearish candles in green and the bullish in red?!
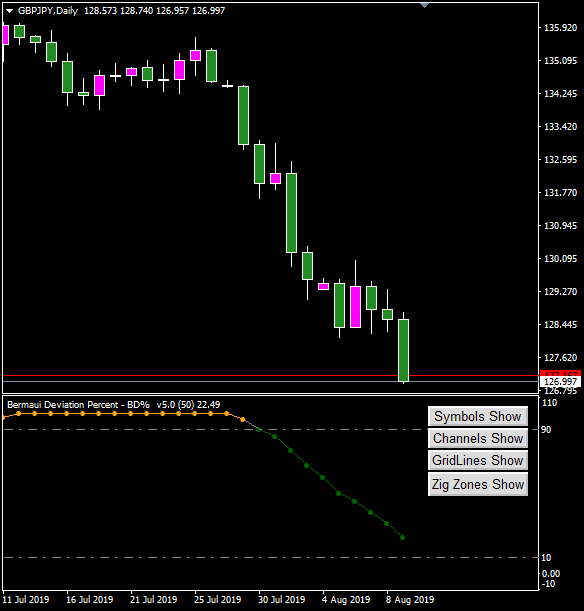
.
Of course No. Because we trained our eyes to see the opposite scenario where green means up and red means down. As in the next pic.
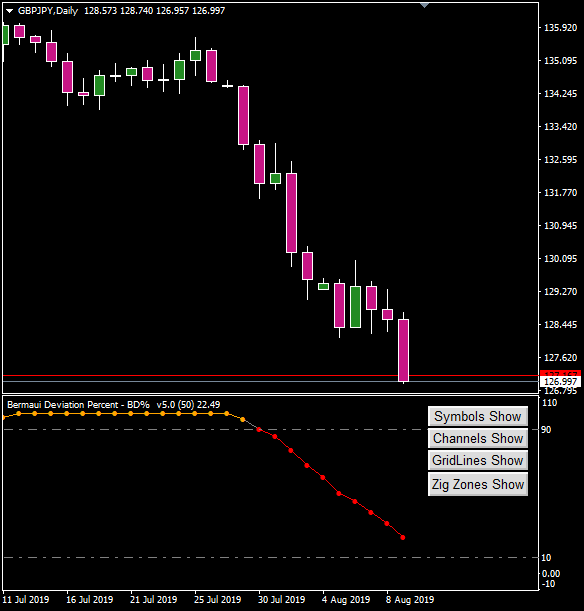
.
Manual trading is a kind of an art, where every color on the chart affect the emotions of the trader and his decisions. So, a good manual trader will take care of his chart colors to reflect his ideas in a better way.
The next color tricks will be done on Bermaui Deviation Percent but they are applicable also on any indicator that contain a built in "Bermaui Utilities" like:How to make Zig Levels labels invisible?
- Click (CTRL+I) to see indicators on the chart.
- Choose Bermaui Deviation Percent to open parameters.
- Go to the last section in parameters that is related to the "Zig Levels".
- Double click on the parameter "Zig Label Color" and convert it to "None".
This will make the color of the label disappear the next time you add the Zig Levels to your chart. Next GIF will explain this in details.
.
You can use the same trick to hide any object you want. As an example you can hide support or resistance levels.
.
How to Focus Color on Standard Deviation Channel?
I really like this trick, because it focuses the color on the overbought and oversold area of the built-in standard deviation channel. So, when Price go to the extreme of the channel I can see what happen clearly. Take a look to the next comparison GIF.
.
Here are the steps
- Click (CTRL+I) to see indicators on the chart.
- Choose Bermaui Deviation Percent to open parameters.
- Go to section six from the parameters (BD% CHANNELS)
- Set "Draw Channel as Background" to true.
- Set the "Inner Channel Color" & the "Outer Channel Color" to be the same color (ex: Blue).
Because both channels now have the same color and both work as background the inner channel color will disappear by the effect of the outer channel, and you will see only the area between them which is the overbought & oversold area. Next GIF will explain it in details.
.
Conclusion
- Indicator colors is important for manual trading because they reflect the trader emotions.
- Manual trading is a kind of an art, where every color on the chart affect the emotions of the trader and his decisions.
- You can hide the color of any object on the chart in MT4 by choosing "Color None".
- You can show channels as area of overbought and oversold.
I hope you liked this blog and all the tricks inside it. You can see my product list from here:
https://www.mql5.com/en/users/bermaui314/seller#products
If you need anything send me a message and I will answer as soon as I am online.
Muhammad Al Bermaui, CMT


 Trading Guide")

")