
______________________________________
12 Months Currency Score Strength
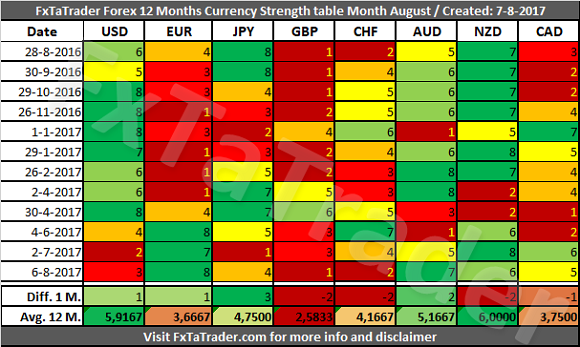
The 12 Months Currency Strength and the 12 Months Average are provided here below. This data and the "12 months Currency Classification" are considered for deciding on the preferred range. Because it is not ideal nor desired to change the range for a currency every single month, we perform several checks to avoid this.
- First of all the strength over a period of the last 12 months is considered. See each row for more information.
- Next, the 12 months average is considered, see the last row called "Avg. 12 M."
- The number of months that a currency was stronger than another currency can also be considered.
- The Technical Analysis (TA) Charts for each Time Frame could also be consulted.
For analyzing the best pairs to trade looking from a longer-term perspective the last 12 months Currency Classification can be used in support.
This was updated on 2 July 2017 and is provided here for reference purposes:
Strong: USD, NZD. The preferred range is from 7 to 8.
Neutral: JPY, AUD, CHF. The preferred range is from 4 to 6.
Weak: EUR, GBP, CAD. The preferred range is from 1 to 3.
When looking at the Average 12 M. Score we can see that the USD and the NZD are clearly grouped together as Strong currencies.
We can also see that the EUR, CHF and GBP are grouped together being all Weak currencies. The CHF lost some strength in the last 2 months and the Average 12 M. Score shows that this currency is in between the Neutral and Weak currencies.
The Weak currencies are the EUR, CAD and GBP. Although the last Score of the EUR was the highest Score of the month, the Average 12 M. Score is still the lowest, after the GBP, of all the currencies.
_____________________________________
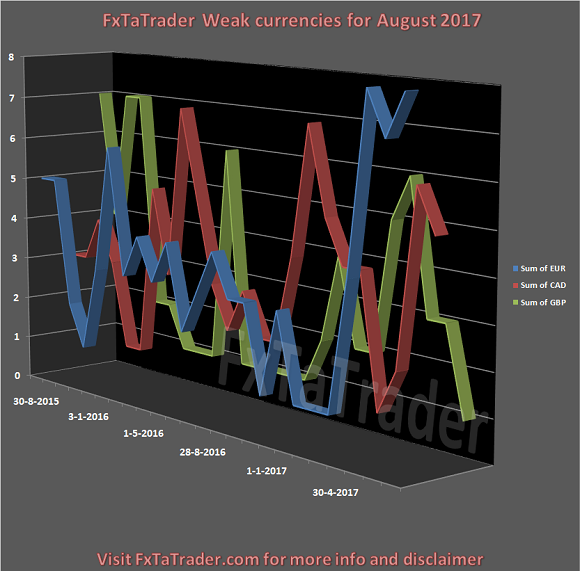
Classification review
This month we take a look at the Weak currencies. As can be seen in the chart the EUR gained a lot of strength in the last 3 months. The GBP lost a lot of strength in the last 3 months. Both currencies remain very weak, the CAD remains more at the center of the range and has the highest score of all the 3 Weak currencies.
Below you can see the Monthly Currency Score Chart with the 6 months' data as a reference.
_____________________________________
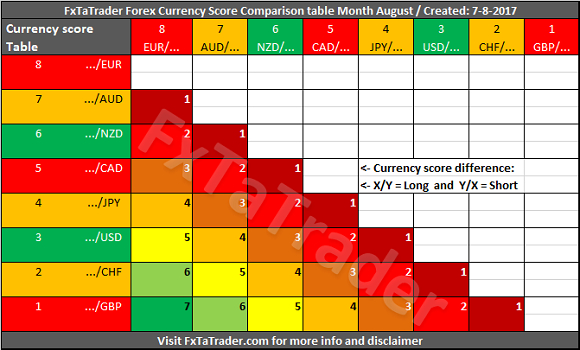
Currency Score Comparison
"Comparison table" and the "Ranking and Rating list"
The Forex Currency Comparison Table compares each currency with its counterpart based on the Currency Score. For more information about the currency Score of this month, you can read the article "Forex Ranking, Rating and Score" which is published every month together with this article.
By using the comparison table directly below you can get a view without the volatility and statistics as opposed to the "Ranking and Rating list". Only the strength of each currency against the counterparts is analyzed by using the Technical analysis charts of the 4 Time Frames that are also used for the "Ranking and Rating List".
The information from the Comparison Table is the source for calculating the "Ranking and Rating List" where this list additionally uses the volatility and statistics for creating the best and worst performer in the list from number 1 to 28.
The information is published once a month and be aware that rates change during this period. The mentioned scores also change and different opportunities may show up. There are many ways to follow the rate changes. This can be done e.g. by looking at the charts and checking e.g. the Ichimoku and/or MACD in the Monthly and Weekly chart. There are also many tools, apps and websites where the movement of trading rates of currencies is shown in different automated ways. This may be in pips or through percentage differences or by comparing the values of indicators like the RSI, Moving Averages, MACD, Ichimoku etc. On my blog a Heatmap is available that can be of use also.
"Comparison table" and the "Currency Score Chart"
The additional value of this table compared to the Currency Score table is that the Comparison Table compares the strength between the currencies of each pair. By subtracting the strength of the weaker currency from the stronger currency we have a way to compare each pair combination.
The comparison table provides a way to compare currencies from a longer-term perspective of 12 months and also simultaneously taking the current trend into account. By coloring the currencies in the X and Y axis according to their Classification we can show what the best combinations are.
Comparison table Guide
- First of all better-classified currencies in combination with weaker-classified currencies can always be traded and vice versa. The Currency Score difference may be negative. In that case, the trade should be made after a pullback. In other words, a trade can then only take place after a recovery and the main trend being confirmed again.
- Second, only equally classified currencies are approved when there is a positive Currency Score difference. Also here, the trend has to be confirmed again.
The difference between point 2 and 1 is that the long trend is not clear with 2 equally qualified currencies because that pair is in a sideway market. For that reason, the Currency Score difference cannot have a negative difference. A positive difference confirms the momentum for a short revival. - Third, only Neutral currencies are Approved against a better-classified currency when there is a Currency Score difference of at least +4. In the case of a currency worse classified, the Currency Score difference has to be at least -4.
The above-mentioned situations applicable to this point may happen when there is a clear reversal and the chart is showing a new trend with good entries in the new direction. The difference between point 3 and the previous 2 points is that with point 3 a reversal in the whole market is possible when looking at all the currencies together. This gives a better chance when a trend reversal takes place compared to point 1 and 2! - By preference, each currency should be selected for a trade with a score difference as far apart from each other as possible in the range from 1 to 8. However, these opportunities are rare and for that reason point 1 offers flexibility and is the best choice to trade, point 2 is the second best and point 3 is the third best choice.
- The classification of the currencies in question may change in the longer term. Even though currencies may be in the same category a currency may be in a weaker/stronger period and may even change its classification in the future. See the current classification for the coming period at the beginning of this article.
______________________________________
Putting the pieces together
Based on the last "12 Months currency classification" and the "Currency Comparison Table" the most interesting currencies for going long seem to be the:
AUD and NZD.
These are Strong or Neutral currencies from a longer term perspective when looking at the last "12 Months currency classification".
For going short the same analysis can be done and the following currencies seem to fit best:
GBP and CHF.
These are Weak or Neutral currencies from a longer term perspective.
Currencies with a high deviation seem less interesting to trade because they are less predictable. A good example now is/are e.g. the:
EUR, USD and CAD.
______________________________________
Besides this article, I also use the Forex "Ranking, Rating and Score" which is also available once a month on my blog. In the article "Ranking, Rating and Score" we look in more detail at the absolute position of the currencies and pairs.
It is recommended to read the page "Currency score explained", "Introduction to the FxTaTrader Forex Models" and "Statistics and Probabilities" for a better understanding of the article. If you would like to use this article then mention the source by providing the URL FxTaTrader.com or the direct link to this article. Good luck in the coming month.
______________________________________
DISCLAIMER: The articles are my personal opinion, not recommendations, FX trading is risky and not suitable for everyone.The content is for educational purposes only and is aimed solely for the use by ‘experienced’ traders in the FOREX market as the contents are intended to be understood by professional users who are fully aware of the inherent risks in forex trading. The content is for 'Forex Trading Journal' purpose only. Nothing should be construed as a recommendation to purchase any financial instruments. The choice and risk are always yours. Thank you.


")
