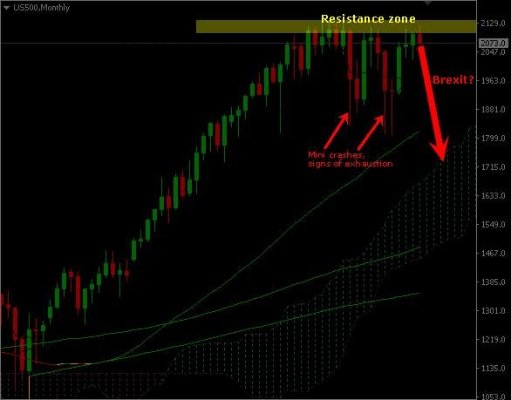
All Blogs / My Trading / Charts All Blogs Analytics & ForecastsWeekly TrendsForecastsTrading SystemsMy TradingChartsTrading StrategiesStatisticsTrading IdeasScalpingNeural NetworksWave CountMarket NewsCurrencyMetalsCrude OilCompany NewsEventsBanksBrokersLaw/RegulationsOther Rules Charts S&P 500 18 June 2016, 11:54 Lahcene Ouled Moussa 0 207 The SPX500 is just about to complete a triple top pattern, possibly leading to its biggest leg down since 2008, should GB decide next week to leave the EU. Could become a case of perfect timing. Source To add comments, please log in or register Prop Firms Make Money When You Fail. Here's Where I'd Put $500. My Trading 27 0 Panther Trade Scenario in the Real Market: A Complete Review of the Trading Day on XAUUSD My Trading 36 0 Why I Size Every Trade as a Fixed % of Equity (Before I Click Buy) Trading Strategies 34 0 Price Action Trading Strategy: How ICONIC Neurocore AI and ICONIC BTC AI Turn Market Structure Into Data-Driven Executio Trading Strategies 36 0 Your EA Isn't Broken. It's Working. (Why Losing Months Are the Point) My Trading 35 0 Panther Trade Scenario indicator trade review on XAUUSD from June 15 to 19, 2026 My Trading 33 0 XAUUSD, EURUSD, USDJPY: Review of trades of the Owl Smart Levels system from June 15 to 19, 2026 My Trading 52 0 June Comeback: From a Challenging May to Explosive Growth 🚀 My Trading 35 0 1 Repeating +29,325% gold signal via Gold Beaver Trading Strategies 72 0 101 Top 5 High-Impact Economic Events This Week (June 22–28, 2026) 76 [XAUUSD]: Weekly Liquidity Activation Points (timings), June 22-26, 2026 67 Fundamental Market Analysis for June 22, 2026 (EURUSD, GBPUSD, USDJPY) forex technical analysis eurusd EUR/USD gbpusd gold usdjpy GBP/USD usd/jpy usd Trading AUD/USD usd/chf S&P 500 forecast usd/cad Fed bitcoin Fxwirepro dax fundamental analysis VistaBrokers Gold spot ($) Silver spot ($) Crude Oil (WTI) USD/TRY audusd EUR forex news ECB


")
![[XAUUSD]: Weekly Liquidity Activation Points (timings), June 22-26, 2026](https://c.mql5.com/6/1013/splash-preview-771790.png "[XAUUSD]: Weekly Liquidity Activation Points (timings), June 22-26, 2026")
")