Analytical Review of the Stocks Apple Inc. of 20.05.2016
Apple Inc., #AAPL [NASD]
Consumer goods, Electronic equipment, USA
Financial performance of the company:
Index – DJIA, S&P 500;
Beta – 0.93;
Capitalization – 534.66 В;
Return on asset – 19.20%;
Income - 75.9 B;
Average volume – 47.64 М;
P/E - 10.25;
ATR – 3.09.
Analytical review:
- The company ranks the first on capitalization among the issuers traded in the American stock market;
- At the end of April the company issued report for Q1 of the fiscal year 2016, according to which company’s revenues fell by 12.8% to 50.6 billion USD against market expectations of 51.97 billion USD. Net profit fell to 1.90 USD per share versus 2.33 USD per share for the same period a year ago;
- At the press-conference company’s authorities said that the indices fell due to the decline of sales of Apple products. In the reporting period sales of iPhone fell by 16.3% to 51.19 billion. Sales of iPad and iMac fell to 10.2 million and 4 million against expectations of decline to 9.95 million and 4.53 million respectively;
- Apple Inc. continues to develop and diversify its business. Last year the company acquired 15 hi-tech companies. The company is aggressively penetrates into Chinese market. The company invested 1 billion USD into the taxi service Didi Chuxing;
- Multipliers also demonstrate effectiveness of the management. The company has the best rates of profitability of capital and investment among closest competitors in the whole industry. ROI is 23.06%. The return on equity is more than 39%. The average value in the industry is 8.81% and 12.75%, respectively.
Summary:
- Despite the decline in revenue and net profit, the company has strong growth potential;
- Apple’s Multipliers show efficiency of the company compared with the results in the industry. Successful implementation of the investment projects will contribute to the improvements of the financial performance of the company;
- It is likely that in the near future company’s quotes will go up.
Trading tips for CFD of Apple Inc.
Key levels:
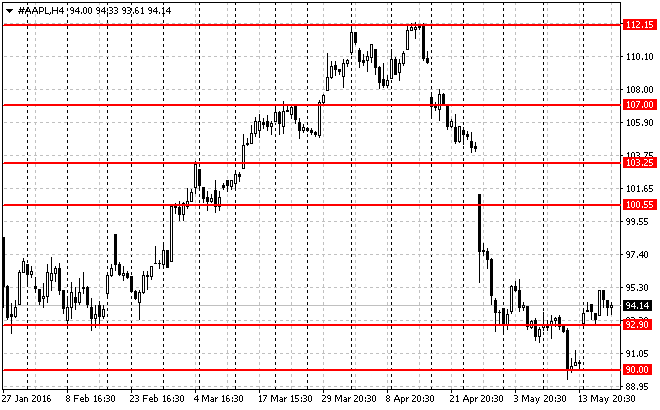
Support levels: 92.90 USD and 90.00 USD.
Resistance levels: 97.50 USD, 100.55 USD and 103.25 USD.
Medium-term trading, Н4
The issuer is traded near demand zone of 90.00-92.90 USD. If the price maintains this zone and in case of the respective confirmation (such as pattern Price Action), we recommend to open long positions. Risk per trade is not more than 2% of the capital. Stop order can be placed slightly below the signal line. Take profit can be placed in parts at the levels of 97.40 USD, 100.50 USD and 103.20 USD with the use of trailing stop.

Medium-term trading, Н4
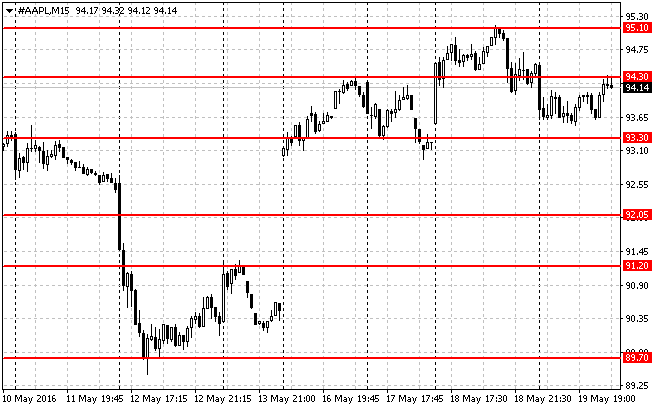
Short-term trading, М15
The issuer is traded between the local support and resistance levels of 93.30/94.30 USD. It is recommended to enter the market after breaking out and testing of these levels. Positions can be opened towards the signal line and the nearest support/resistance levels. Risk per trade is not more than 3% of the capital. Stop order can be placed slightly above/below the signal line. Take profit can be placed in parts of 50%, 30% and 20% with the use of trailing stop..

Short-term trading, М15


