Technical Analysis of USDX for April 15, 2016
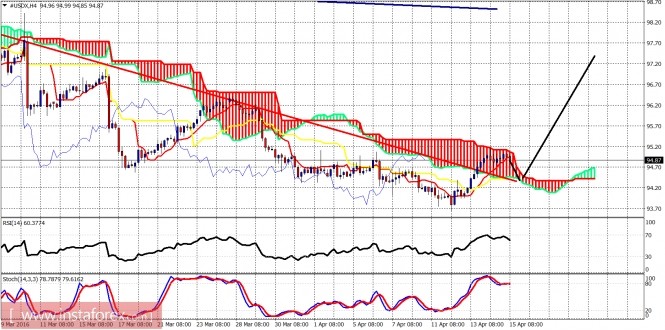
The Dollar index made a pause in its upward breakout above the downward sloping wedge. The price has reached important short-term resistance levels and a small pullback to re-test the breakout area is justified.

Red line - resistance (broken)
Black line - possible price path
The Dollar index has managed to break above the red trend line resistance but not above the 4-hour chart cloud. A pullback to re-test the breakout above the red trend line is very likely, so a pullback towards 94.40-94.30 is also possible. A break below the cloud will not be a good sign. On the other hand, a break above 95.20 will be a bullish sign confirming the trend reversal.

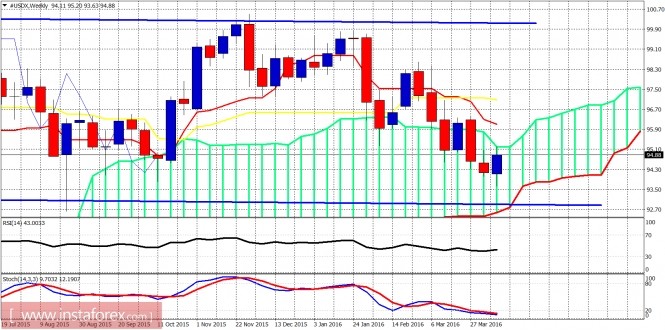
Blue lines - trading range
The Dollar index is reversing on a weekly basis. The price has reached the upper cloud boundary which is the weekly resistance. This 95-95.20 level is an important resistance and once we break above it we should be heading towards 96 at least. The short-term trend has changed back to bullish. The stochastic is oversold, but not turning upwards yet. I believe we are near an important turning point.
The material has been provided by InstaForex Company - www.instaforex.com


